¶Introduction
Now that we have the data ready, let’s explore it. Particularly, let’s investigate the physical stats of the Pokemon, namely the height (meters) and weight (kilograms) of the Pokemon, and any relationships that exist with the Pokemon’s characteristics.
¶Load Libraries
Start off by loading the libraries we need.
# Load libraries
library(dplyr)
library(tidyr)
library(ggplot2)
library(ggpmisc)
library(RColorBrewer)
library(gridExtra)
¶Read and Format Data
Read in the data we scraped in the previous steps. We also need to make sure to set some column types in order to group and summarize the data. The Generation and Evolution.Place columns are categorical, and the Has.Evolution column is boolean, so we need to specify those column types.
# Read the data
pokedex <- read.csv('~/Projects/pokedex/data/pokedex_ext.csv',sep=',')

# Change categorical columns
pokedex$Generation <- as.factor(pokedex$Generation)
pokedex$Evolution.Place <- as.factor(pokedex$Evolution.Place)
pokedex$Has.Evolution <- as.logical(pokedex$Has.Evolution)
pokedex$Attack <- as.numeric(pokedex$Attack)

# Show Pokedex data
head(pokedex)
| Number | Name | URLs | Type.1 | Type.2 | Species | Height | Weight | HP | Attack | Defense | Sp..Atk | Sp..Def | Speed | Total | Type.3 | Has.Evolution | Evolution.Place | Maximum.Evolution.Count | Evolution.Index | Generation | Legendary.Status |
|---|---|---|---|---|---|---|---|---|---|---|---|---|---|---|---|---|---|---|---|---|---|
| 1 | Bulbasaur | https://pokemondb.net/pokedex/bulbasaur | Grass | Poison | Seed Pokémon | 0.7 | 6.9 | 45 | 49 | 49 | 65 | 65 | 45 | 318 | TRUE | 1 | 3 | 0.33 | 1 | ||
| 2 | Ivysaur | https://pokemondb.net/pokedex/ivysaur | Grass | Poison | Seed Pokémon | 1 | 13 | 60 | 62 | 63 | 80 | 80 | 60 | 405 | TRUE | 2 | 3 | 0.67 | 1 | ||
| 3 | Venusaur | https://pokemondb.net/pokedex/venusaur | Grass | Poison | Seed Pokémon | 2 | 100 | 80 | 82 | 83 | 100 | 100 | 80 | 525 | TRUE | 3 | 3 | 1 | 1 | ||
| 4 | Charmander | https://pokemondb.net/pokedex/charmander | Fire | Lizard Pokémon | 0.6 | 8.5 | 39 | 52 | 43 | 60 | 50 | 65 | 309 | TRUE | 1 | 3 | 0.33 | 1 | |||
| 5 | Charmeleon | https://pokemondb.net/pokedex/charmeleon | Fire | Flame Pokémon | 1.1 | 19 | 58 | 64 | 58 | 80 | 65 | 80 | 405 | TRUE | 2 | 3 | 0.67 | 1 | |||
| 6 | Charizard | https://pokemondb.net/pokedex/charizard | Fire | Flying | Flame Pokémon | 1.7 | 90.5 | 78 | 84 | 78 | 109 | 85 | 100 | 534 | TRUE | 3 | 3 | 1 | 1 |
¶Distribution of Height and Weight
Starting off, let’s just look at the distribution of Pokemon height and weight.
# Plot height histogram
p1 <- ggplot(pokedex, aes(x=Height)) +
        geom_histogram(binwidth=0.25,fill="#81a2be",colour="black") +
        theme_minimal() +
        xlab("Height") +
        ylab("Frequency")

# Plot height histogram
p2 <- ggplot(pokedex, aes(x=Weight)) +
        geom_histogram(binwidth=10,fill="#81a2be",colour="black") +
        theme_minimal() +
        xlab("Weight") +
        ylab("Frequency")

# Place both plots on a grid
g <- arrangeGrob(p1, p2, nrow=2)

# Save image
ggsave("images/height_weight_histogram.png",g)
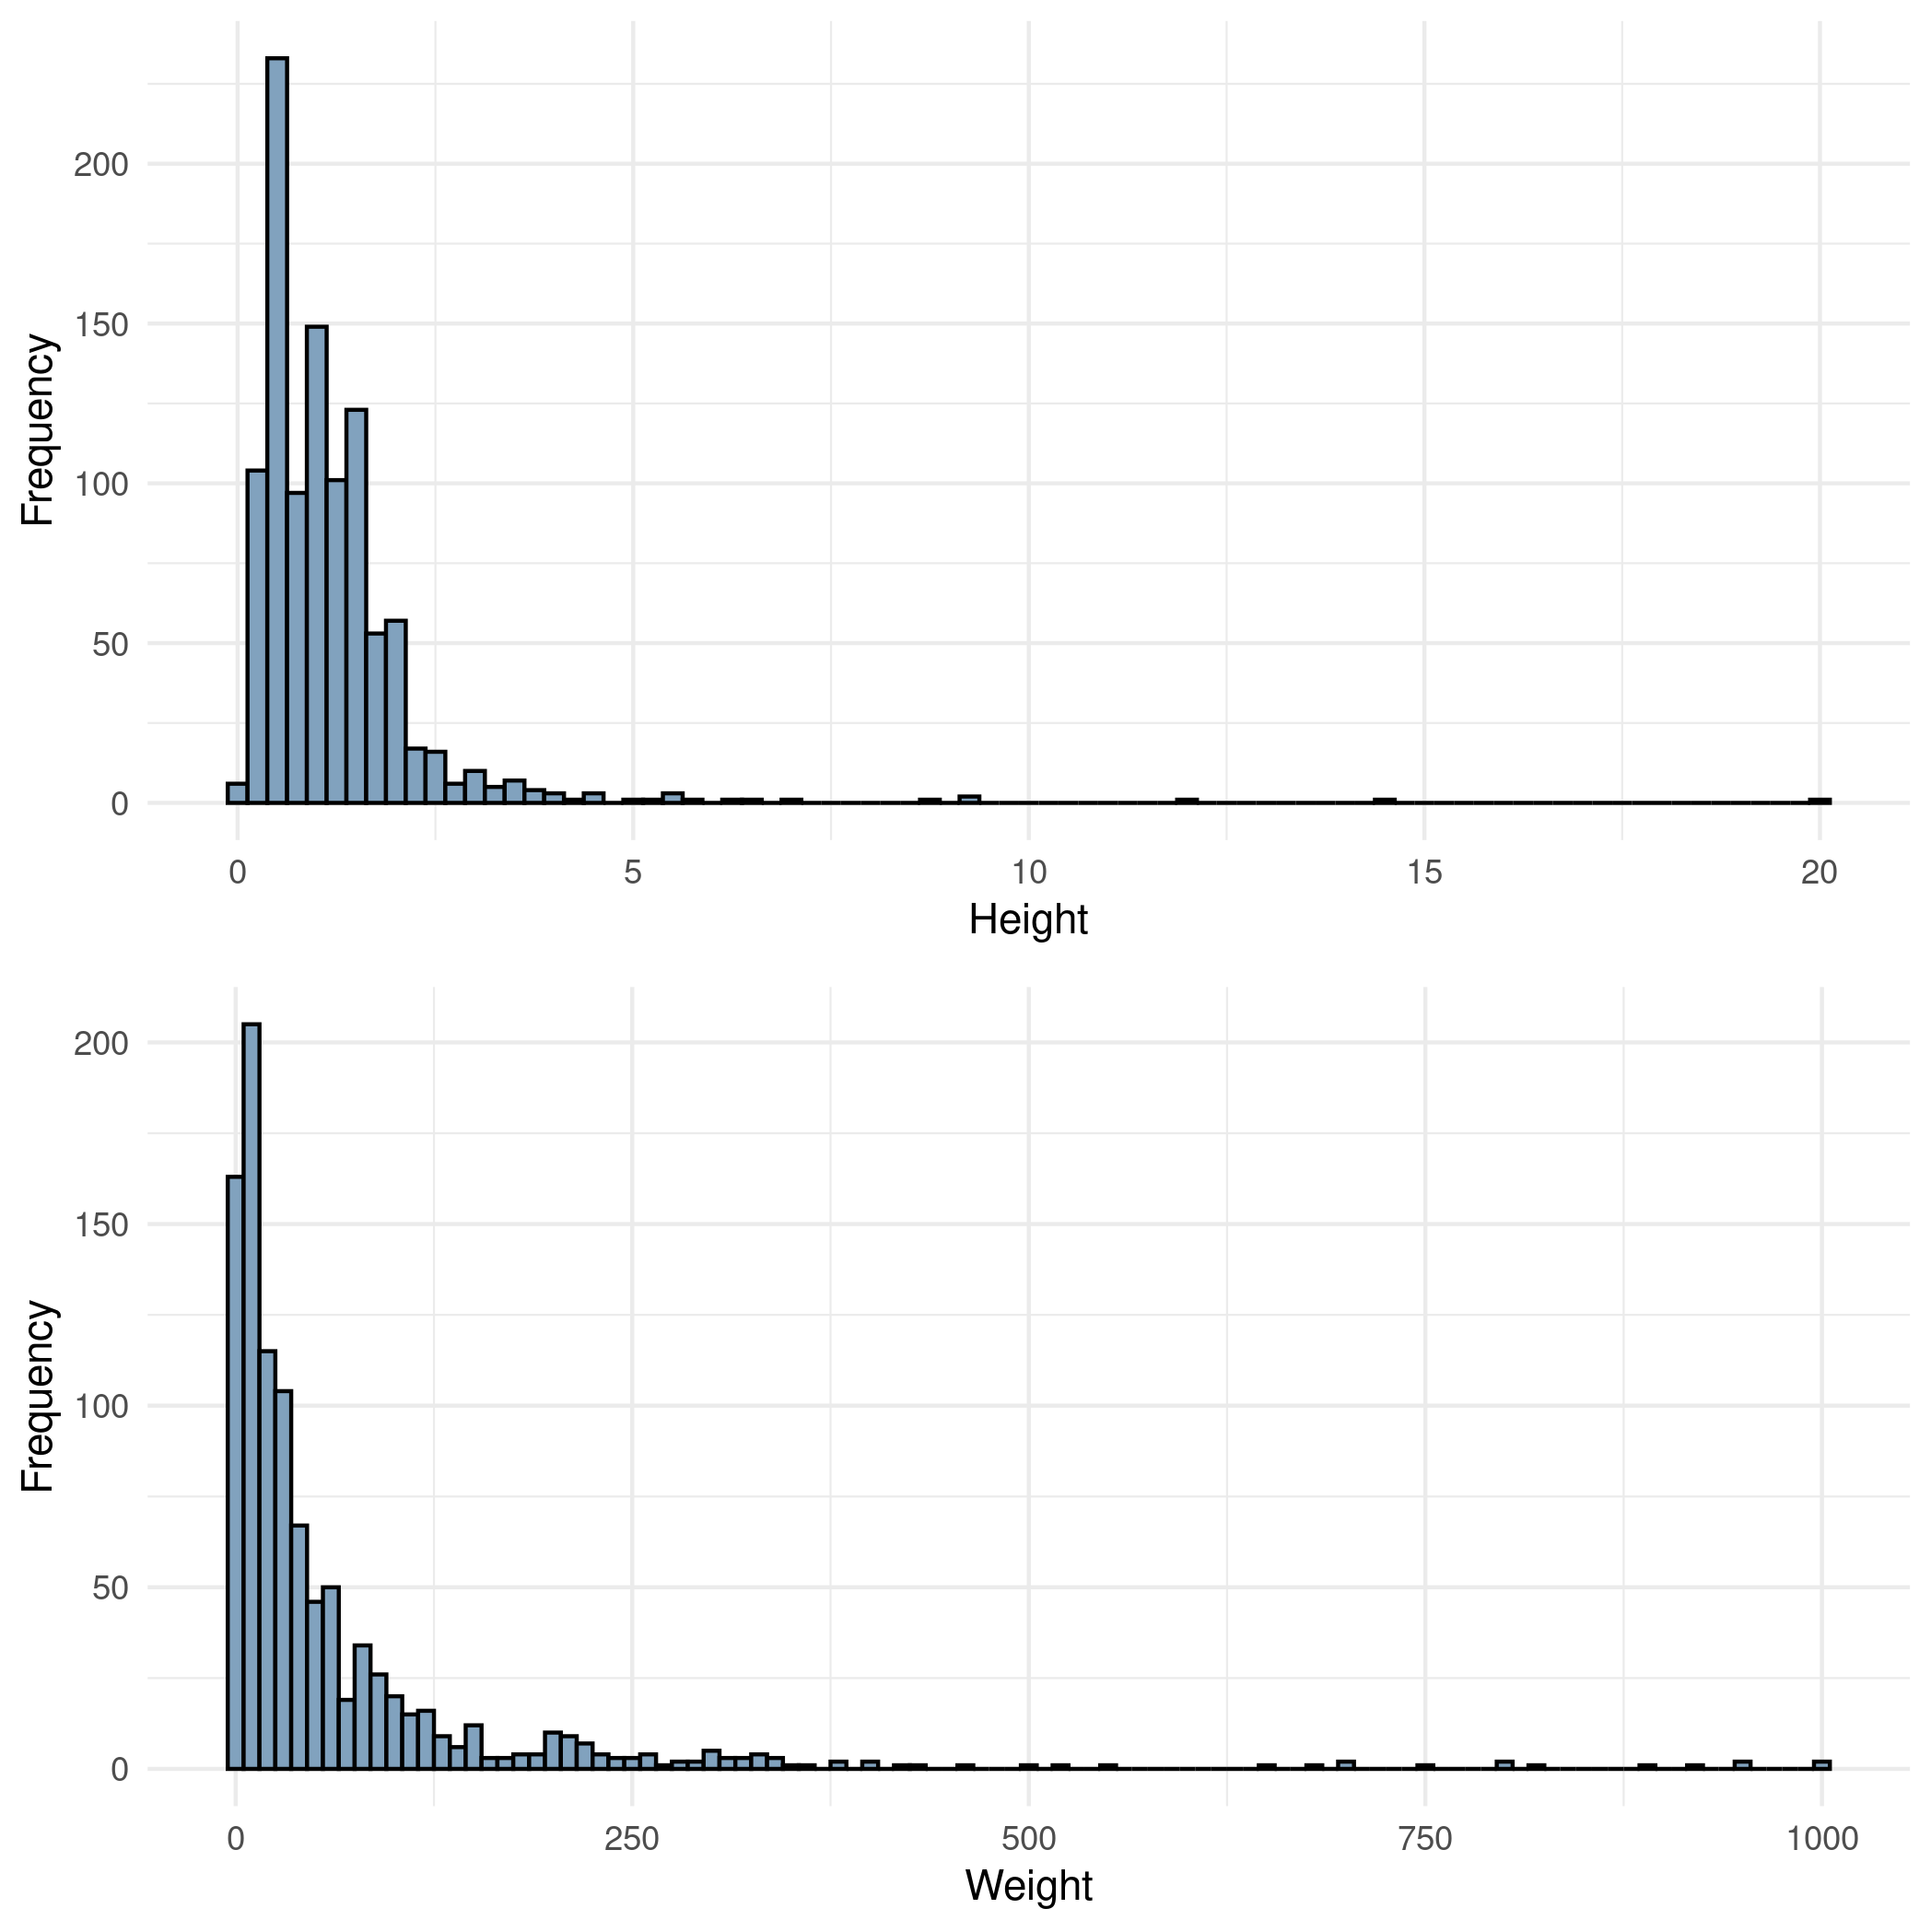
Most Pokemon fall between 0 and 3 meters tall and 0 and 100 kilograms, but there are several outliers up to 20 meters tall and 1000 kilograms.
¶Height Vs. Weight
A pretty obvious relationship we might expect to see is a linear-ish relationship between height and weight of a Pokemon. Let’s plot the height and weight of each Pokemon in the data to see if that is indeed the case.
# Plot height vs weight
ggplot(pokedex, aes(x=Height, y=Weight, ymin=0, alpha=0.5)) +
  geom_point(color="#81a2be",show.legend = FALSE) +
  stat_poly_line(show.legend=FALSE,color="#cc6666") +
  stat_poly_eq(use_label(c("eq", "R2"))) +
  scale_fill_brewer(palette="Dark2") +
  theme_minimal() +
  ggtitle("Physical Stats for all Pokemon") +
  xlab("Height") +
  ylab("Weight")

# Save image
ggsave("images/height_vs_weight.png",bg="white")
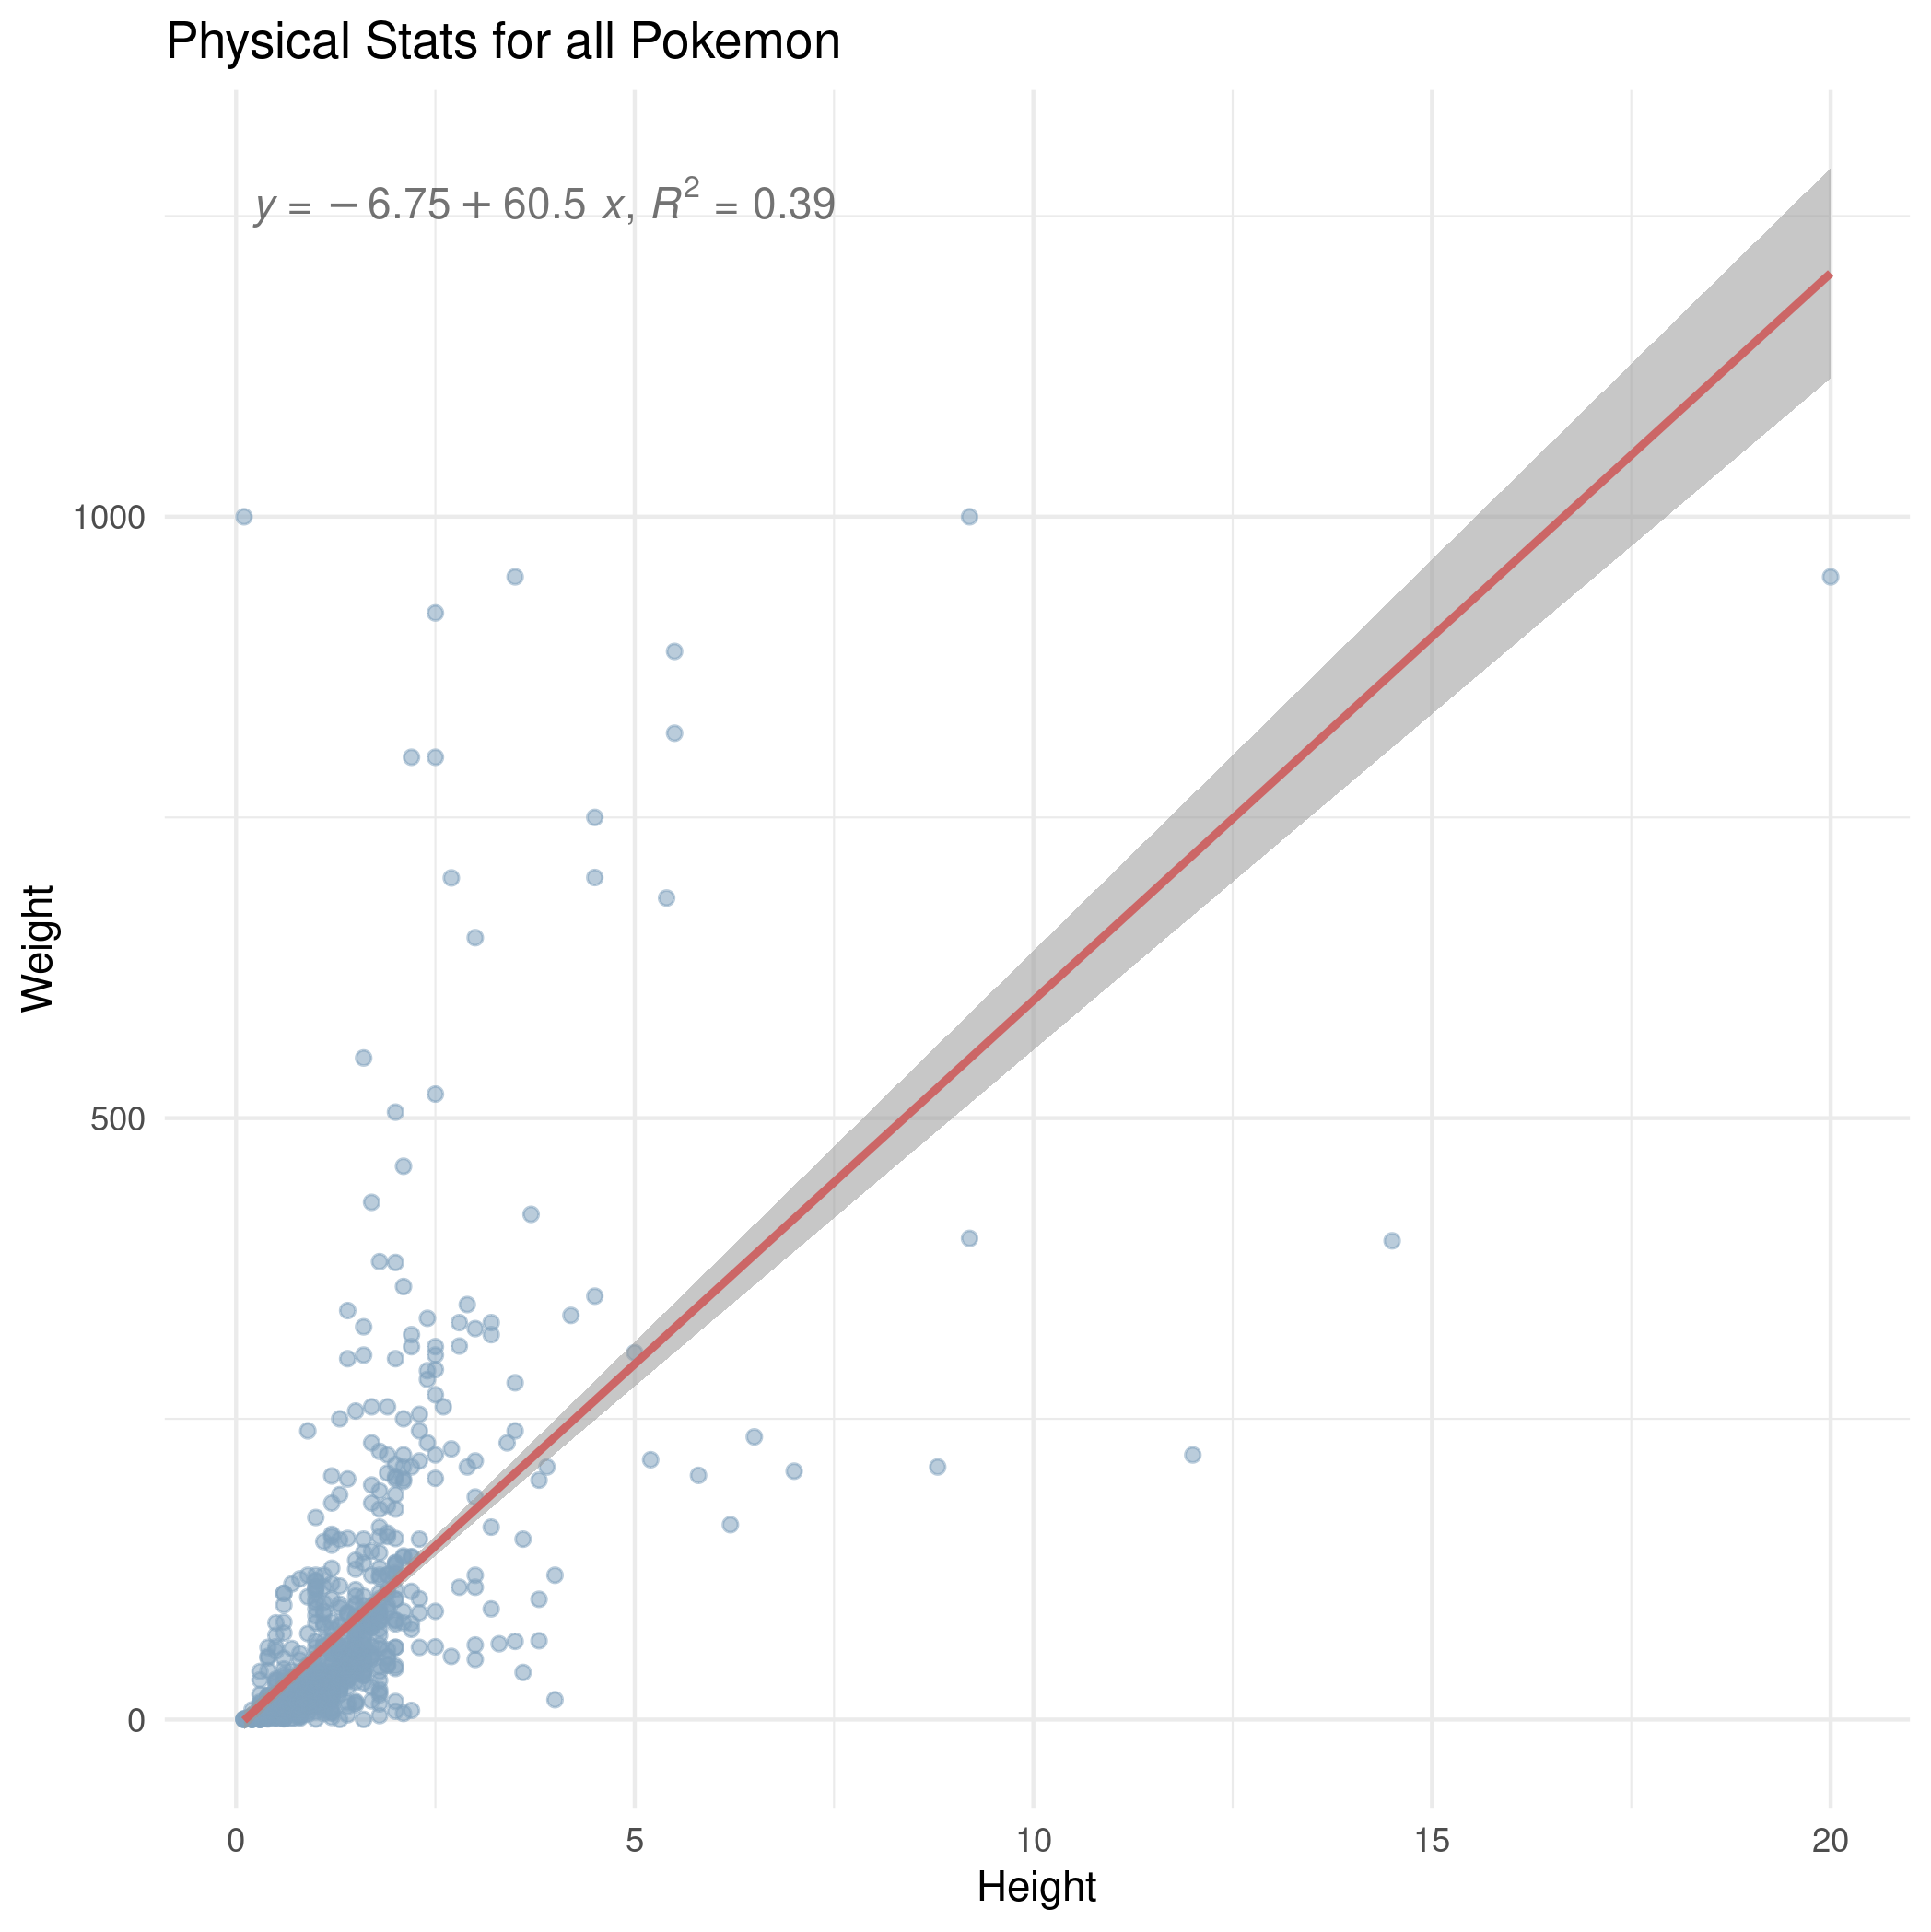
It does seem that the taller a pokemon is, the heavier it is, but the spread isn’t as linear as I thought it might be overall. I’m curious which Pokemon are the ones that are quite tall but also quite light. Maybe they are large, ghost type Pokemon?
# Filter pokemon over 5 meters tall and between 100 and 500 kilograms
pokedex %>%
  filter(Height >= 5) %>%
  filter(Weight >= 100) %>%
  filter(Weight <= 500) %>%
  arrange(Height)
| Number | Name | URLs | Type.1 | Type.2 | Species | Height | Weight | HP | Attack | Defense | Sp..Atk | Sp..Def | Speed | Total | Type.3 | Has.Evolution | Evolution.Place | Maximum.Evolution.Count | Evolution.Index | Generation | Legendary.Status |
|---|---|---|---|---|---|---|---|---|---|---|---|---|---|---|---|---|---|---|---|---|---|
| 718 | Zygarde | https://pokemondb.net/pokedex/zygarde | Dragon | Ground | Order Pokémon | 5 | 305 | 108 | 100 | 121 | 81 | 95 | 95 | 600 | FALSE | 6 | |||||
| 249 | Lugia | https://pokemondb.net/pokedex/lugia | Psychic | Flying | Diving Pokémon | 5.2 | 216 | 106 | 90 | 130 | 90 | 154 | 110 | 680 | FALSE | 2 | Legendary | ||||
| 717 | Yveltal | https://pokemondb.net/pokedex/yveltal | Dark | Flying | Destruction Pokémon | 5.8 | 203 | 126 | 131 | 95 | 131 | 98 | 99 | 680 | FALSE | 6 | Legendary | ||||
| 350 | Milotic | https://pokemondb.net/pokedex/milotic | Water | Tender Pokémon | 6.2 | 162 | 95 | 60 | 79 | 100 | 125 | 81 | 540 | TRUE | 2 | 2 | 1 | 3 | |||
| 130 | Gyarados | https://pokemondb.net/pokedex/gyarados | Water | Flying | Atrocious Pokémon | 6.5 | 235 | 95 | 125 | 79 | 60 | 100 | 81 | 540 | TRUE | 2 | 2 | 1 | 1 | ||
| 384 | Rayquaza | https://pokemondb.net/pokedex/rayquaza | Dragon | Flying | Sky High Pokémon | 7 | 206.5 | 105 | 150 | 90 | 150 | 90 | 95 | 680 | FALSE | 3 | Legendary | ||||
| 95 | Onix | https://pokemondb.net/pokedex/onix | Rock | Ground | Rock Snake Pokémon | 8.8 | 210 | 35 | 45 | 160 | 30 | 45 | 70 | 385 | TRUE | 1 | 2 | 0.5 | 1 | ||
| 208 | Steelix | https://pokemondb.net/pokedex/steelix | Steel | Ground | Iron Snake Pokémon | 9.2 | 400 | 75 | 85 | 200 | 55 | 65 | 30 | 510 | TRUE | 2 | 2 | 1 | 2 | ||
| 977 | Dondozo | https://pokemondb.net/pokedex/dondozo | Water | Big Catfish Pokémon | 12 | 220 | 150 | 100 | 115 | 65 | 65 | 35 | 530 | FALSE | 9 | ||||||
| 321 | Wailord | https://pokemondb.net/pokedex/wailord | Water | Float Whale Pokémon | 14.5 | 398 | 170 | 90 | 45 | 90 | 45 | 60 | 500 | TRUE | 2 | 2 | 1 | 3 |
So that’s not the case. These are actually just the long and slender Pokemon. That makes a lot of sense, I just wasn’t thinking of Pokemon that were long and slender when I saw the original plot.
¶Height vs. Weight vs. Battle Stats
Using that same plot, let’s now add another dimension to the plot by shading the points in the scatter plot based on the Pokemon’s battle stats: HP (health points), attack, defense, special attack, special defense, and speed.
¶Health Points
Let’s start off by comparing height and wieght to each Pokemon’s health points.
p1 <- pokedex %>%
        ggplot(aes(x=Height, y=HP, ymin=0, alpha=0.5)) +
          geom_point(color="#81a2be",show.legend = FALSE) +
          stat_poly_line(show.legend=FALSE,color="#cc6666") +
          stat_poly_eq(use_label(c("eq", "R2"))) +
          theme_minimal() +
          ggtitle("Height vs. Health Points") +
          xlab("Height") +
          ylab("HP")

p2 <- pokedex %>%
        ggplot(aes(x=Weight, y=HP, ymin=0, alpha=0.5)) +
          geom_point(color="#81a2be",show.legend = FALSE) +
          stat_poly_line(show.legend=FALSE,color="#cc6666") +
          stat_poly_eq(use_label(c("eq", "R2"))) +
          theme_minimal() +
          ggtitle("Weight vs. Health Points") +
          xlab("Weight") +
          ylab("HP")

# Place both plots on a grid
g <- arrangeGrob(p1, p2, nrow=2)

# Save image
ggsave("images/height_weight_hp.png",g)
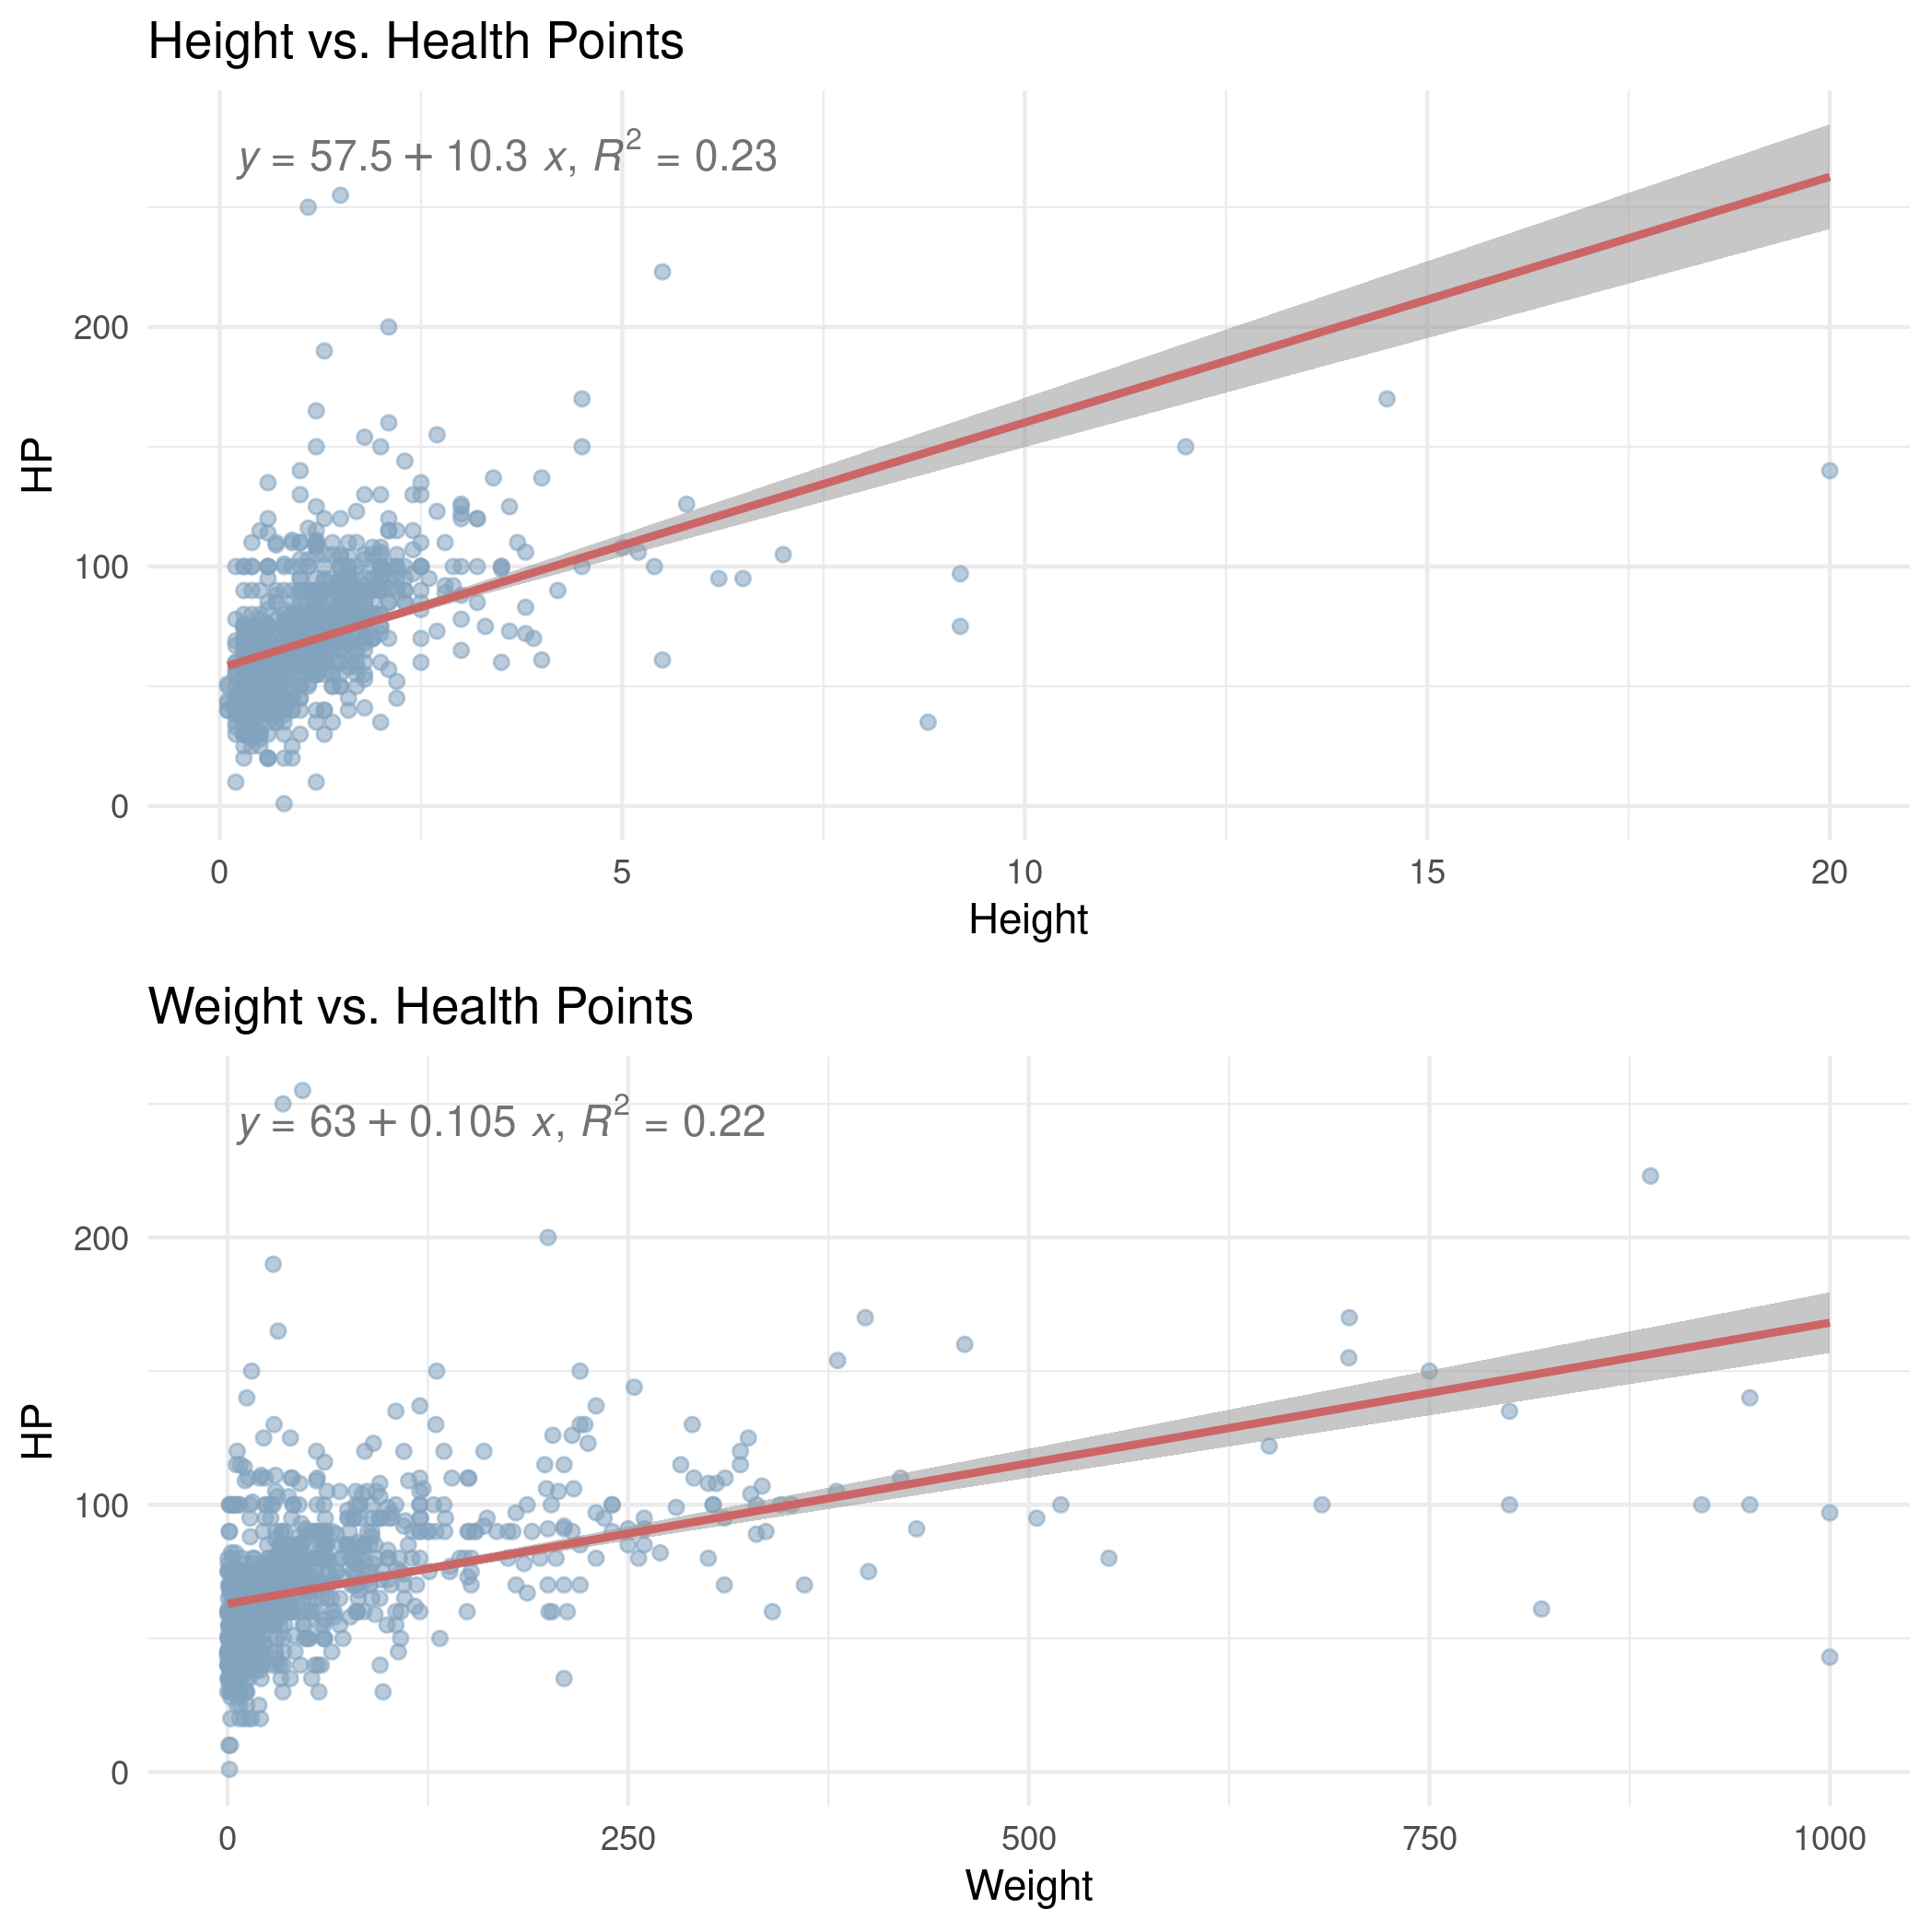
Generally speaking, the greater the height/weight of the Pokemon the more health the Pokemon has. I suspected this, but I figured that the relationship would be a bit stronger for weight. I figured that a heavy pokemon implied the Pokemon could take more hits, while a tall Pokemon could just be tall and lanky and relatively weak. There is of course a correlation between height and weight, but I still figured that regardless of height, a heavier Pokemon would be able to take more hits, but that’s not entirely the case. Additionally, as both the height and weight of Pokemon gets towards the higher end of the spectrum, the general trend of Pokemon having more HP no longer holds and seems to level off.
¶Attack
Next, let’s compare height and wieght to each Pokemon’s attack.
p1 <- pokedex %>%
        ggplot(aes(x=Height, y=Attack, ymin=0, alpha=0.5)) +
          geom_point(color="#81a2be",show.legend = FALSE) +
          stat_poly_line(show.legend=FALSE,color="#cc6666") +
          stat_poly_eq(use_label(c("eq", "R2"))) +
          theme_minimal() +
          ggtitle("Height vs. Attack") +
          xlab("Height") +
          ylab("Attack")

p2 <- pokedex %>%
        ggplot(aes(x=Weight, y=Attack, ymin=0, alpha=0.5)) +
          geom_point(color="#81a2be",show.legend = FALSE) +
          stat_poly_line(show.legend=FALSE,color="#cc6666") +
          stat_poly_eq(use_label(c("eq", "R2"))) +
          theme_minimal() +
          ggtitle("Weight vs. Attack") +
          xlab("Weight") +
          ylab("Attack")

# Place both plots on a grid
g <- arrangeGrob(p1, p2, nrow=2)

# Save image
ggsave("images/height_weight_attack.png",g)
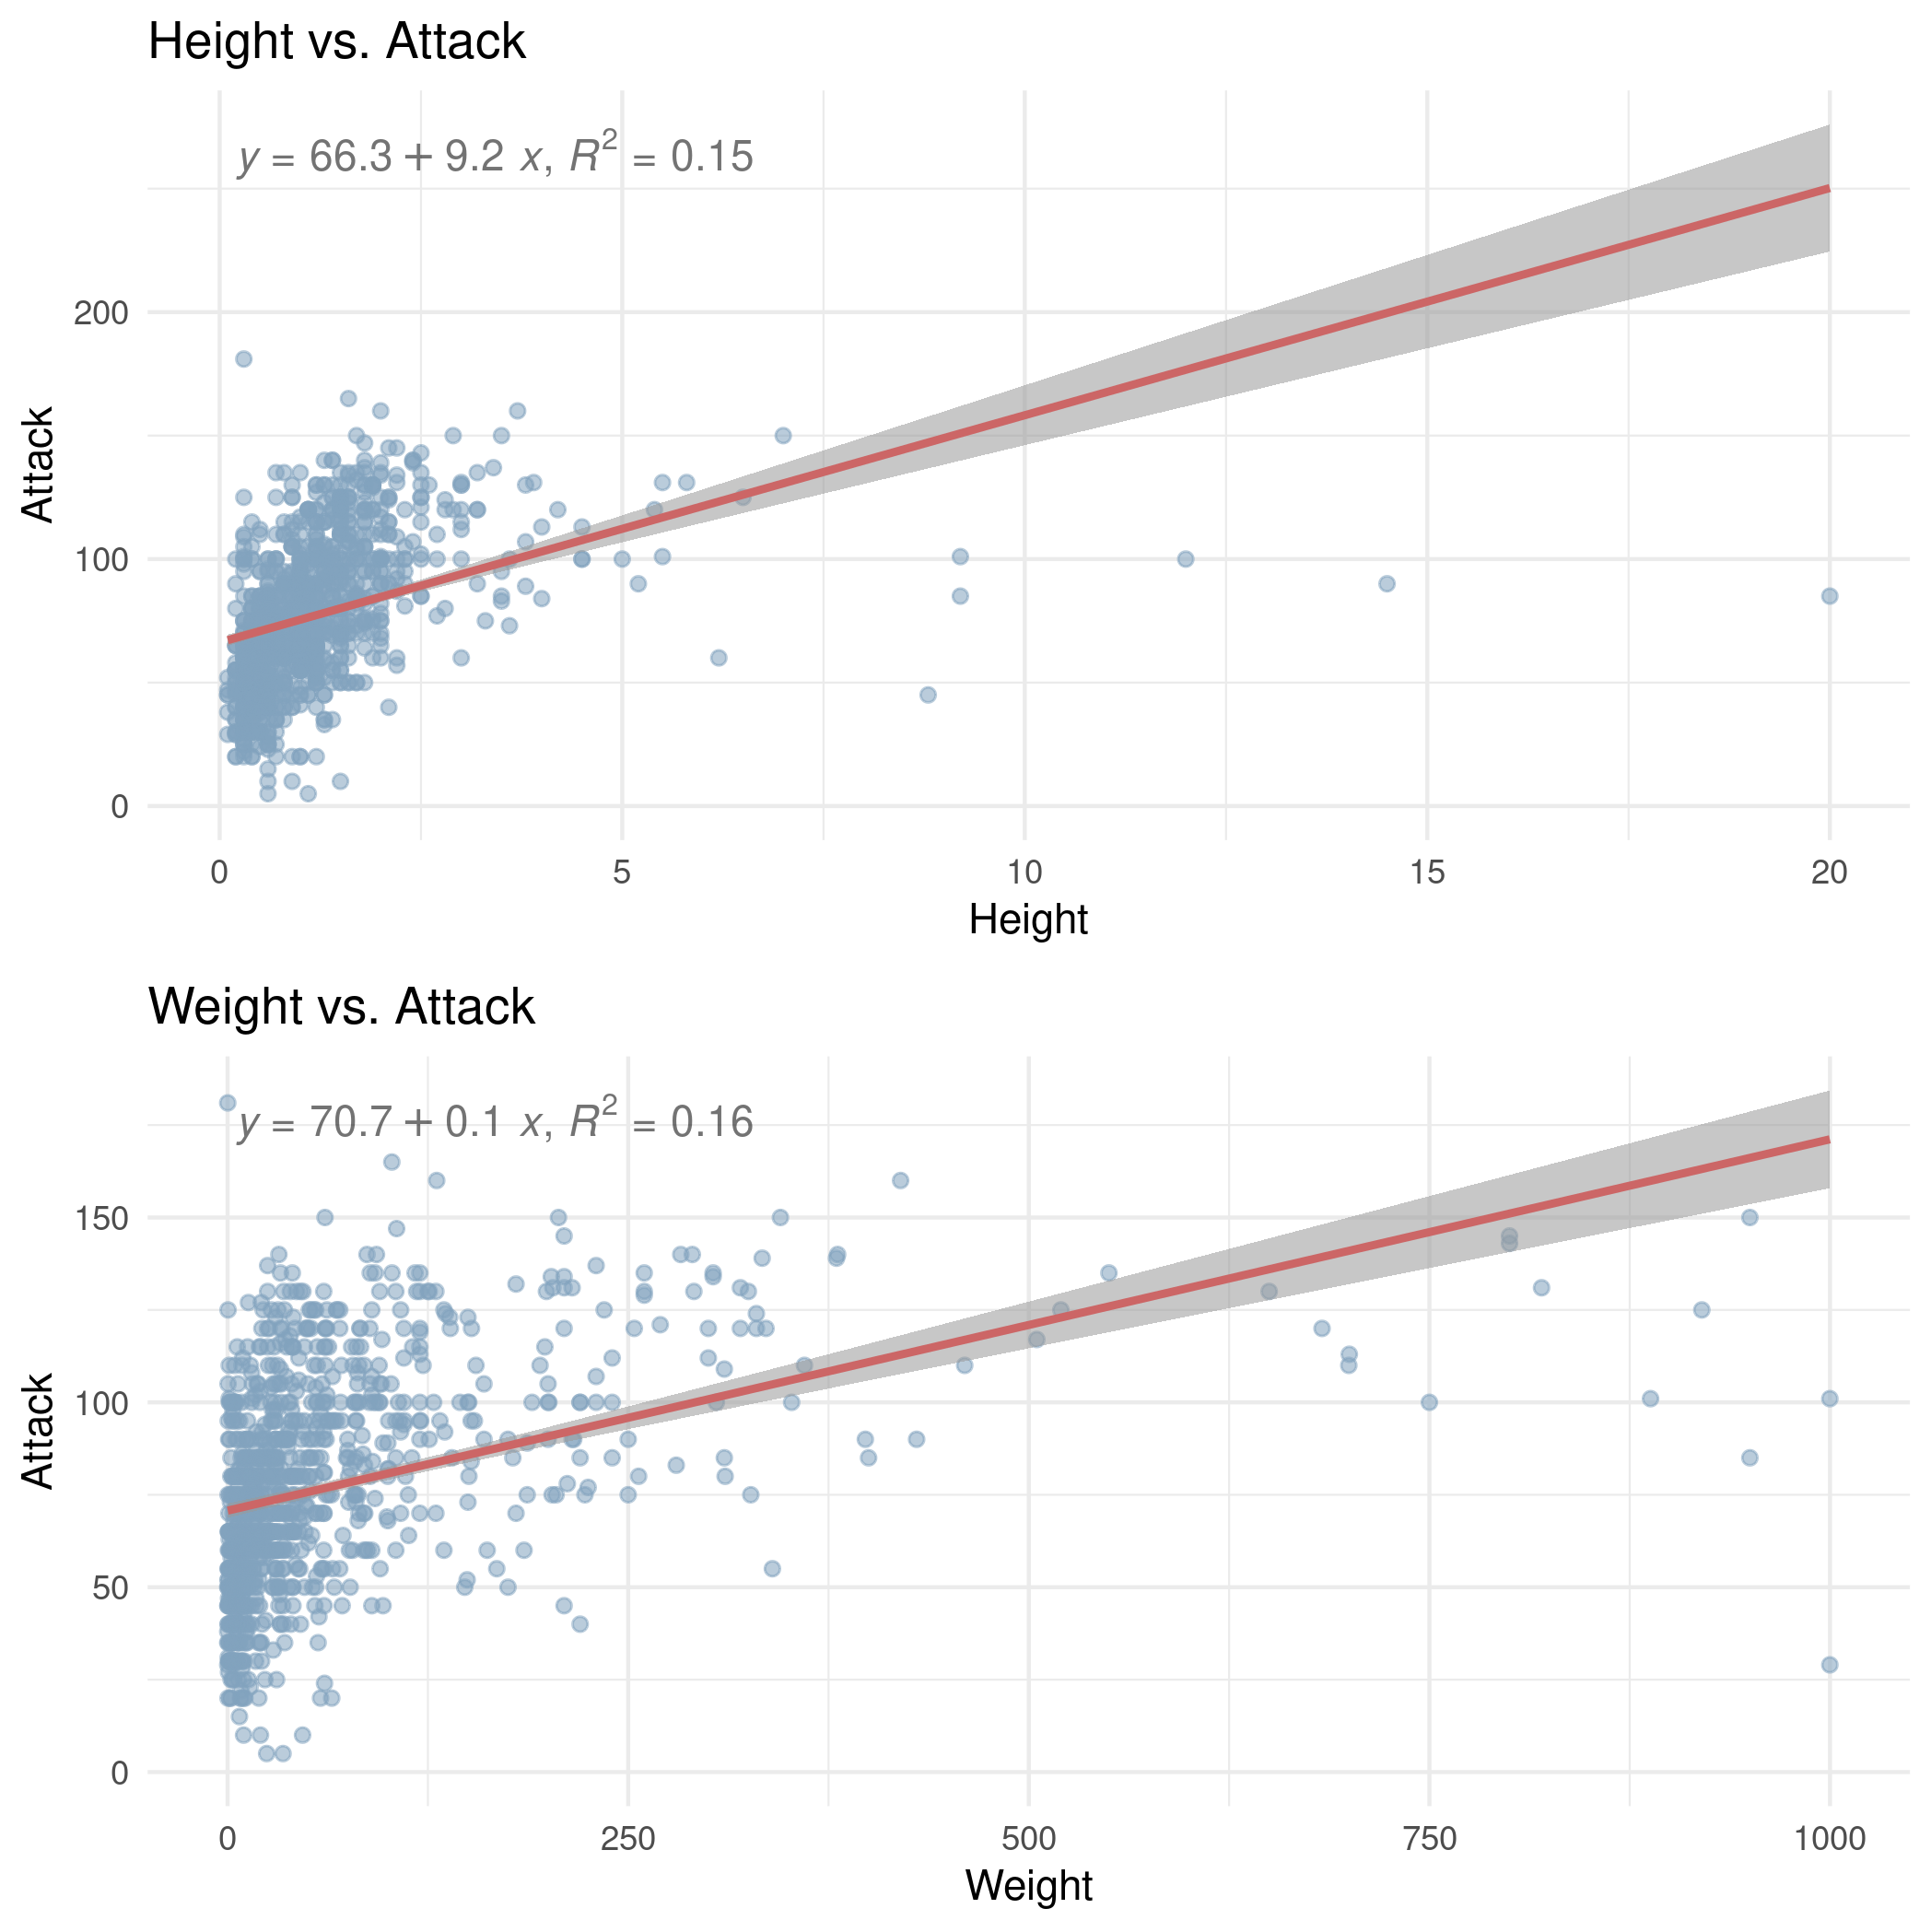
Again, the heavier and taller the Pokemon, the greater the attack, but there is a point where this relationship levels off, beyond about 3 meters tall and 200 kg heavy.
¶Defense
Now we compare height, weight, and defense.
p1 <- pokedex %>%
        ggplot(aes(x=Height, y=Defense, ymin=0, alpha=0.5)) +
          geom_point(color="#81a2be",show.legend = FALSE) +
          stat_poly_line(show.legend=FALSE,color="#cc6666") +
          stat_poly_eq(use_label(c("eq", "R2"))) +
          theme_minimal() +
          ggtitle("Height vs. Defense") +
          xlab("Height") +
          ylab("Defense")

p2 <- pokedex %>%
        ggplot(aes(x=Weight, y=Defense, ymin=0, alpha=0.5)) +
          geom_point(color="#81a2be",show.legend = FALSE) +
          stat_poly_line(show.legend=FALSE,color="#cc6666") +
          stat_poly_eq(use_label(c("eq", "R2"))) +
          theme_minimal() +
          ggtitle("Weight vs. Defense") +
          xlab("Weight") +
          ylab("Defense")

# Place both plots on a grid
g <- arrangeGrob(p1, p2, nrow=2)

# Save image
ggsave("images/height_weight_defense.png",g)
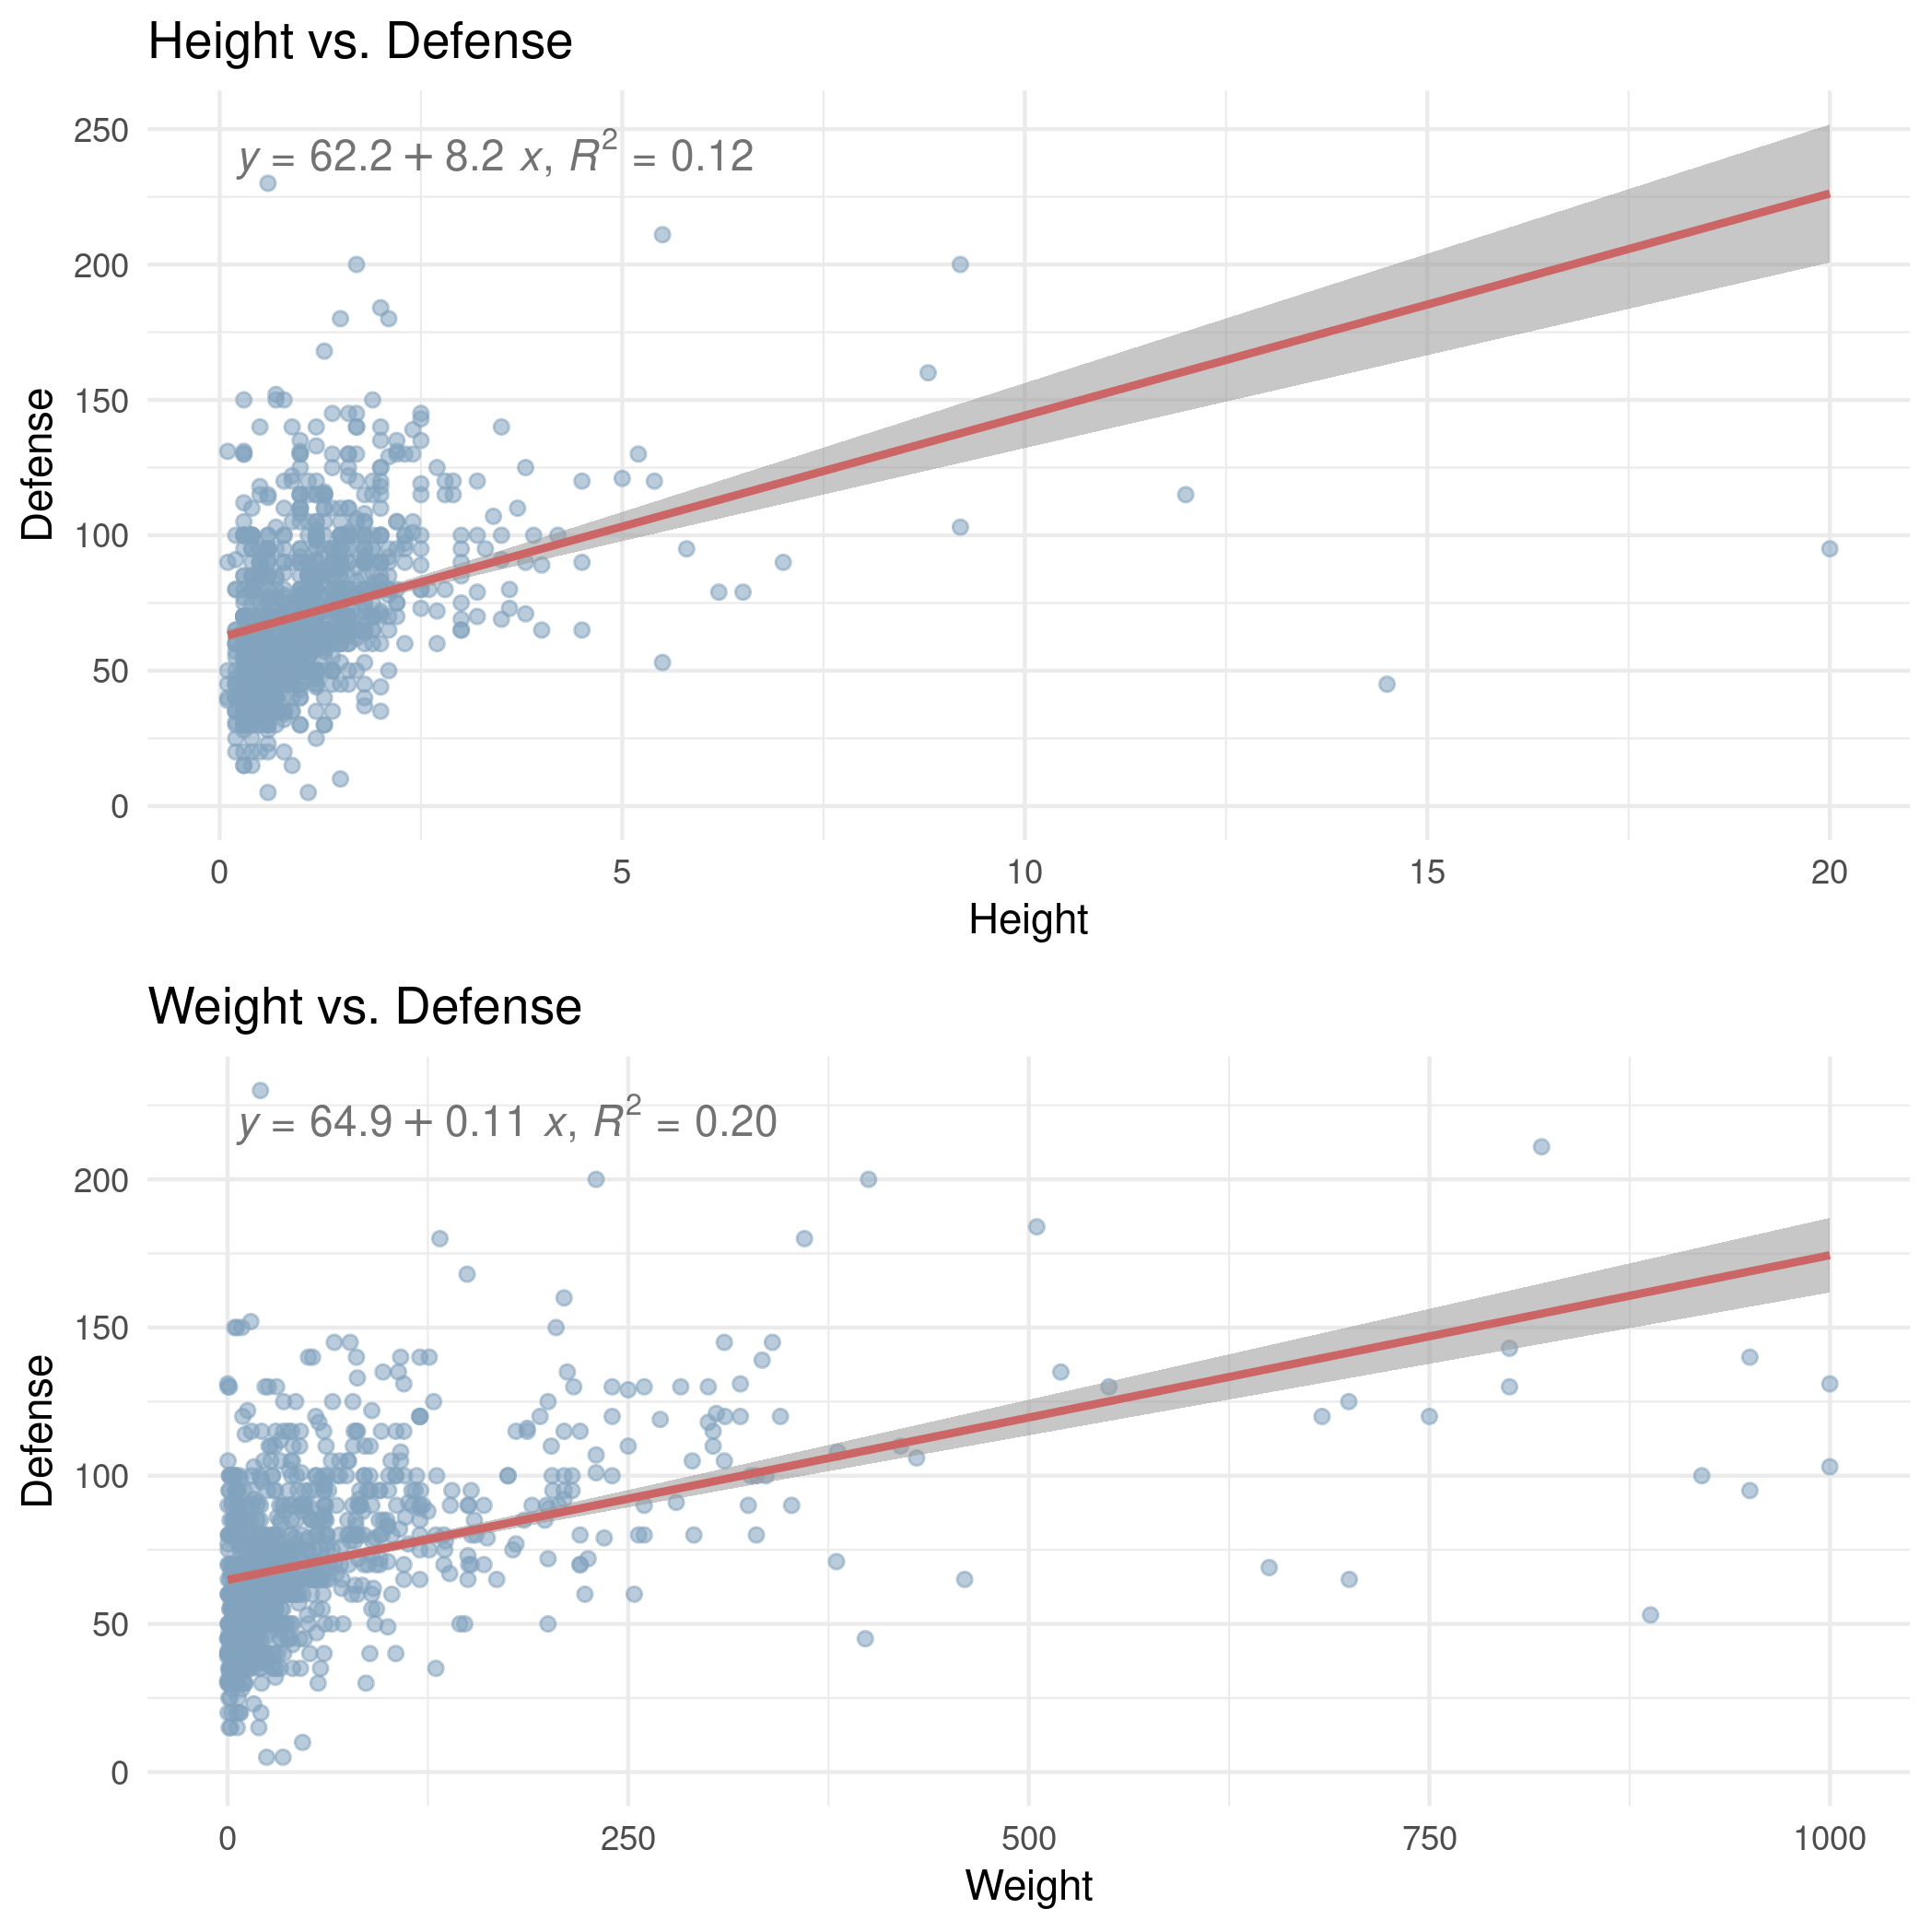
Unsurprisingly, we see the same thing with defense. Generally, the heavier and taller Pokemon have more defense, but atypically tall or heavy don’t particularly have atypically high defense.
¶Special Attack
Next up, we compare height, weight, and special attack.
p1 <- pokedex %>%
        ggplot(aes(x=Height, y=Sp..Atk, ymin=0, alpha=0.5)) +
          geom_point(color="#81a2be",show.legend = FALSE) +
          stat_poly_line(show.legend=FALSE,color="#cc6666") +
          stat_poly_eq(use_label(c("eq", "R2"))) +
          theme_minimal() +
          ggtitle("Height vs. Special Attack") +
          xlab("Height") +
          ylab("Sp..Atk")

p2 <- pokedex %>%
        ggplot(aes(x=Weight, y=Sp..Atk, ymin=0, alpha=0.5)) +
          geom_point(color="#81a2be",show.legend = FALSE) +
          stat_poly_line(show.legend=FALSE,color="#cc6666") +
          stat_poly_eq(use_label(c("eq", "R2"))) +
          theme_minimal() +
          ggtitle("Weight vs. Special Attack") +
          xlab("Weight") +
          ylab("Sp..Atk")

# Place both plots on a grid
g <- arrangeGrob(p1, p2, nrow=2)

# Save image
ggsave("images/height_weight_special_attack.png",g)
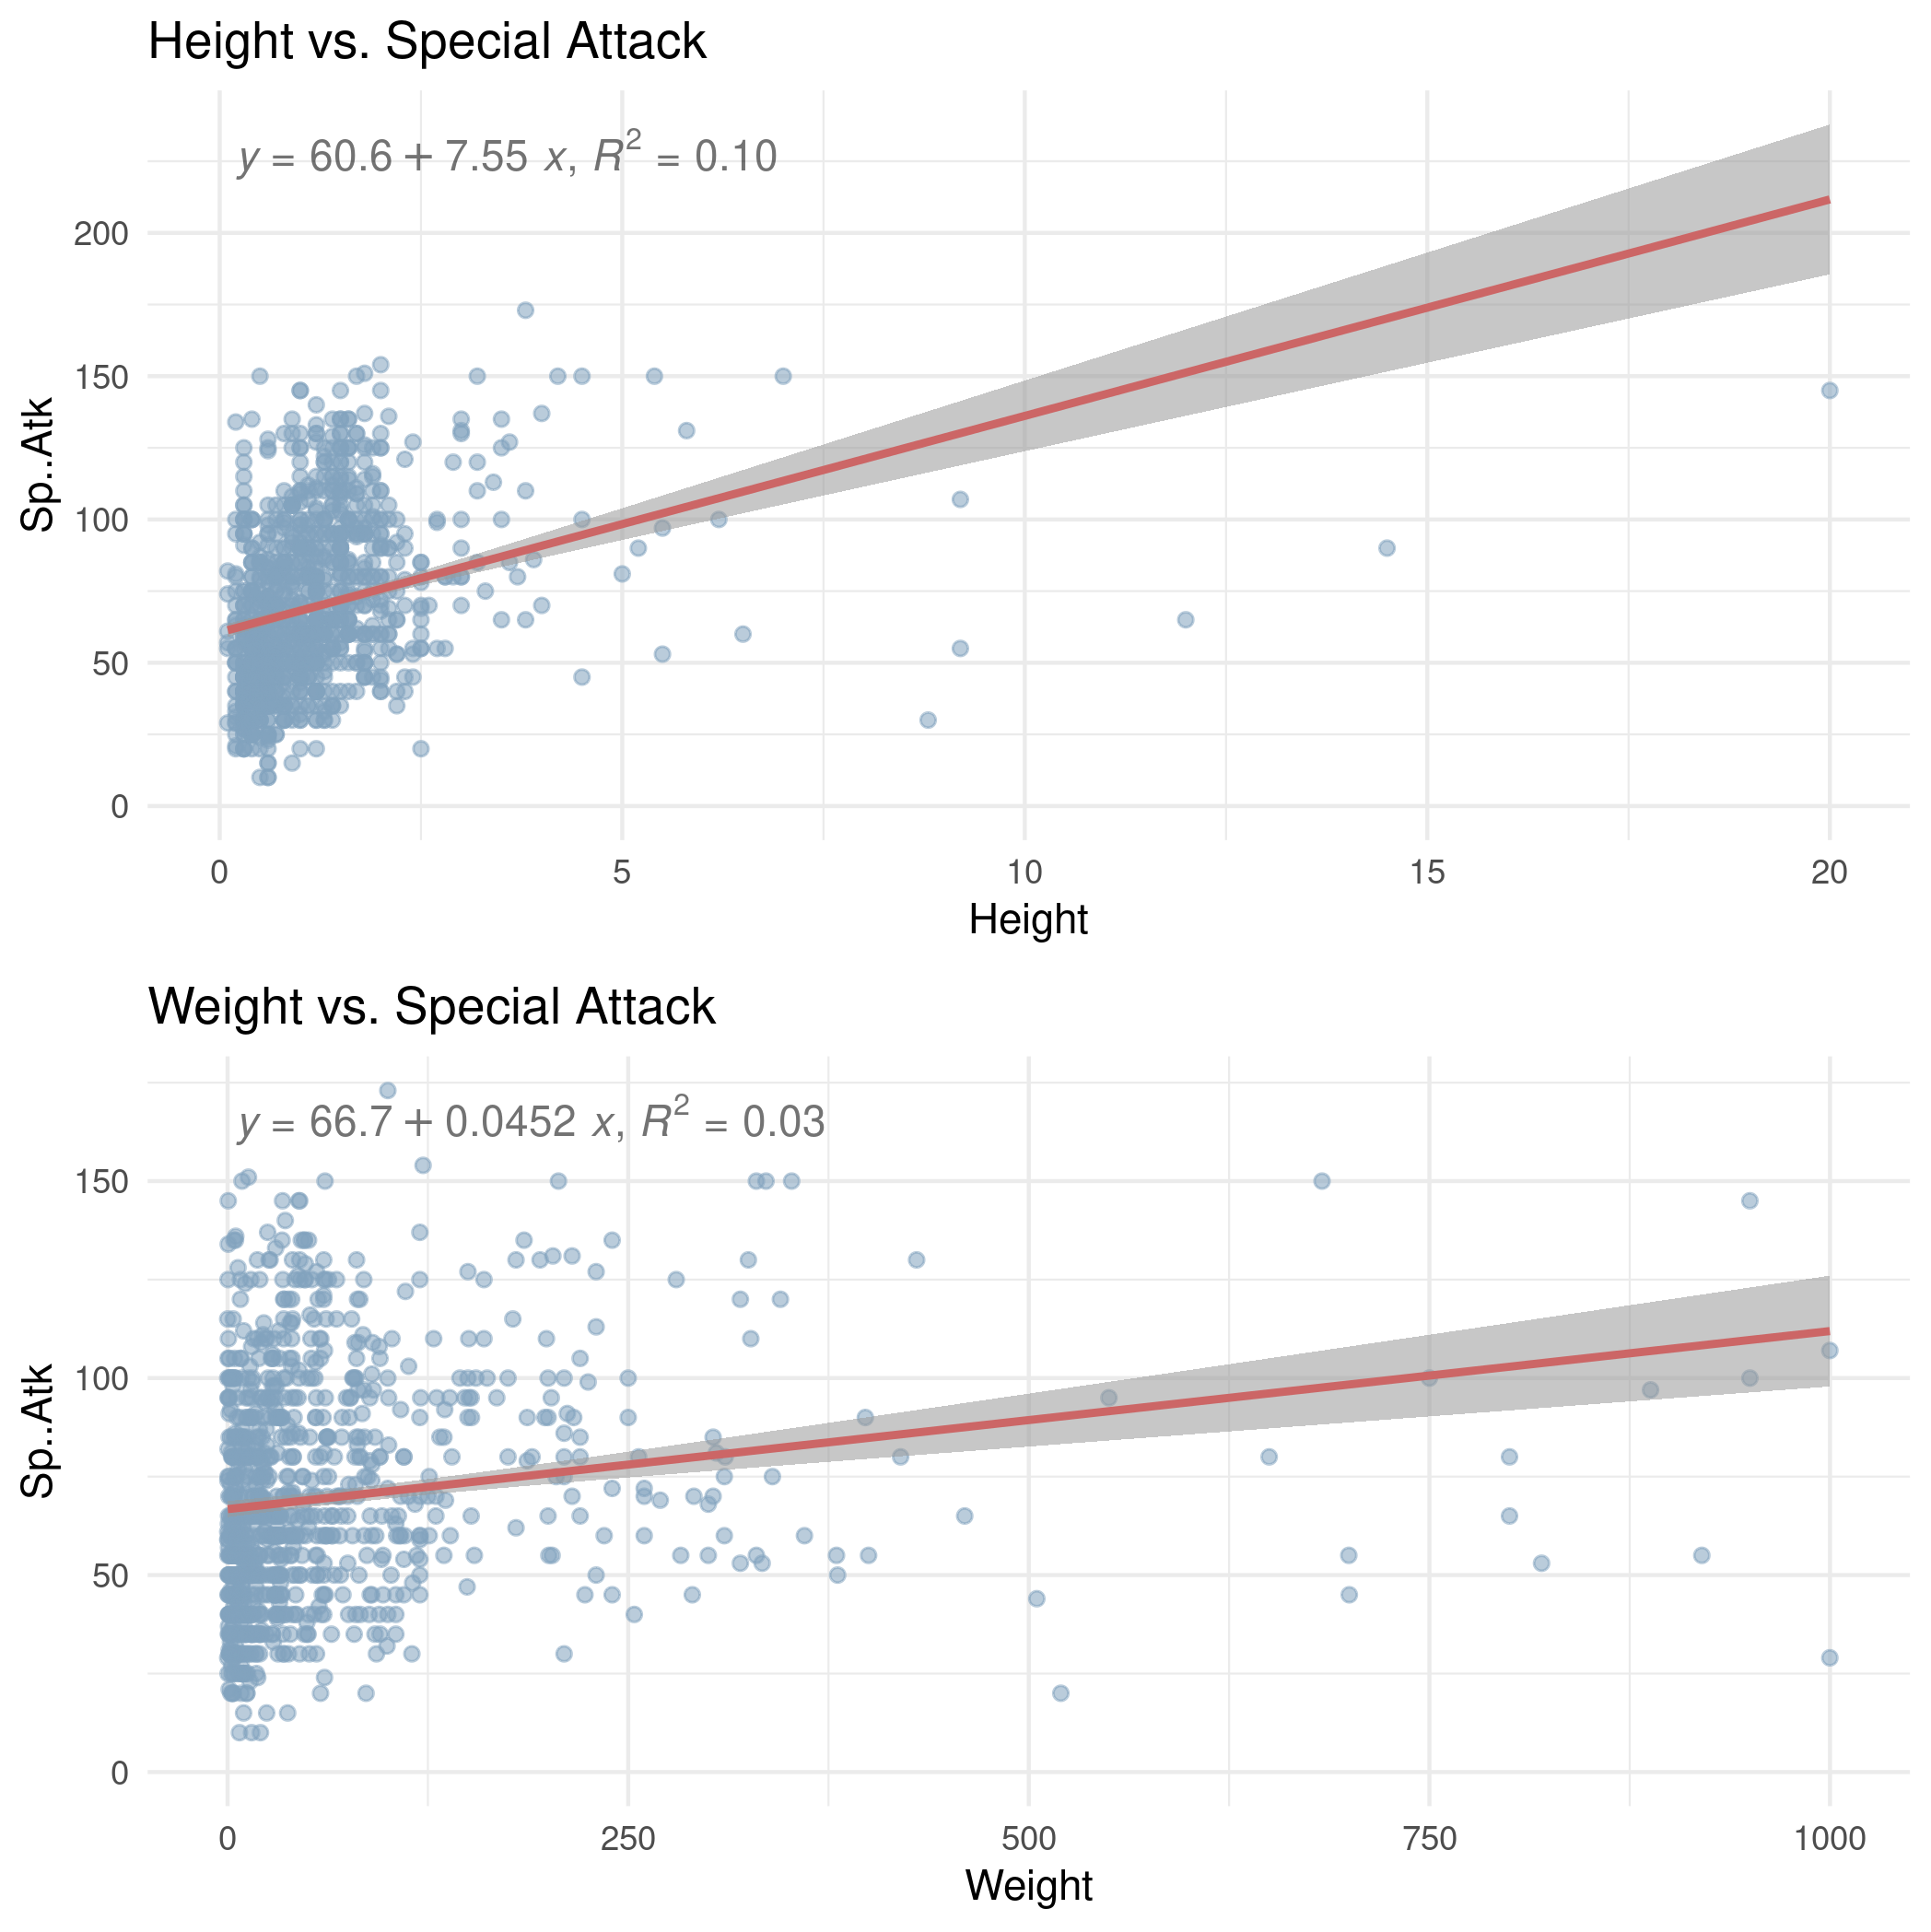
This time, special attack seems to positively correlate with height, but there doesn’t appear to be much of a relationship between weight and special attack. At lower weights, special attack looks normally distributed, and as weight increases, this still looks to be roughly the case.
¶Special Defense
And now, let’s look at height, weight, and special defense.
p1 <- pokedex %>%
        ggplot(aes(x=Height, y=Sp..Def, ymin=0, alpha=0.5)) +
          geom_point(color="#81a2be",show.legend = FALSE) +
          stat_poly_line(show.legend=FALSE,color="#cc6666") +
          stat_poly_eq(use_label(c("eq", "R2"))) +
          theme_minimal() +
          ggtitle("Height vs. Special Defense") +
          xlab("Height") +
          ylab("Sp..Def")

p2 <- pokedex %>%
        ggplot(aes(x=Weight, y=Sp..Def, ymin=0, alpha=0.5)) +
          geom_point(color="#81a2be",show.legend = FALSE) +
          stat_poly_line(show.legend=FALSE,color="#cc6666") +
          stat_poly_eq(use_label(c("eq", "R2"))) +
          theme_minimal() +
          ggtitle("Weight vs. Special Defense") +
          xlab("Weight") +
          ylab("Sp..Def")

# Place both plots on a grid
g <- arrangeGrob(p1, p2, nrow=2)

# Save image
ggsave("images/height_weight_special_defense.png",g)
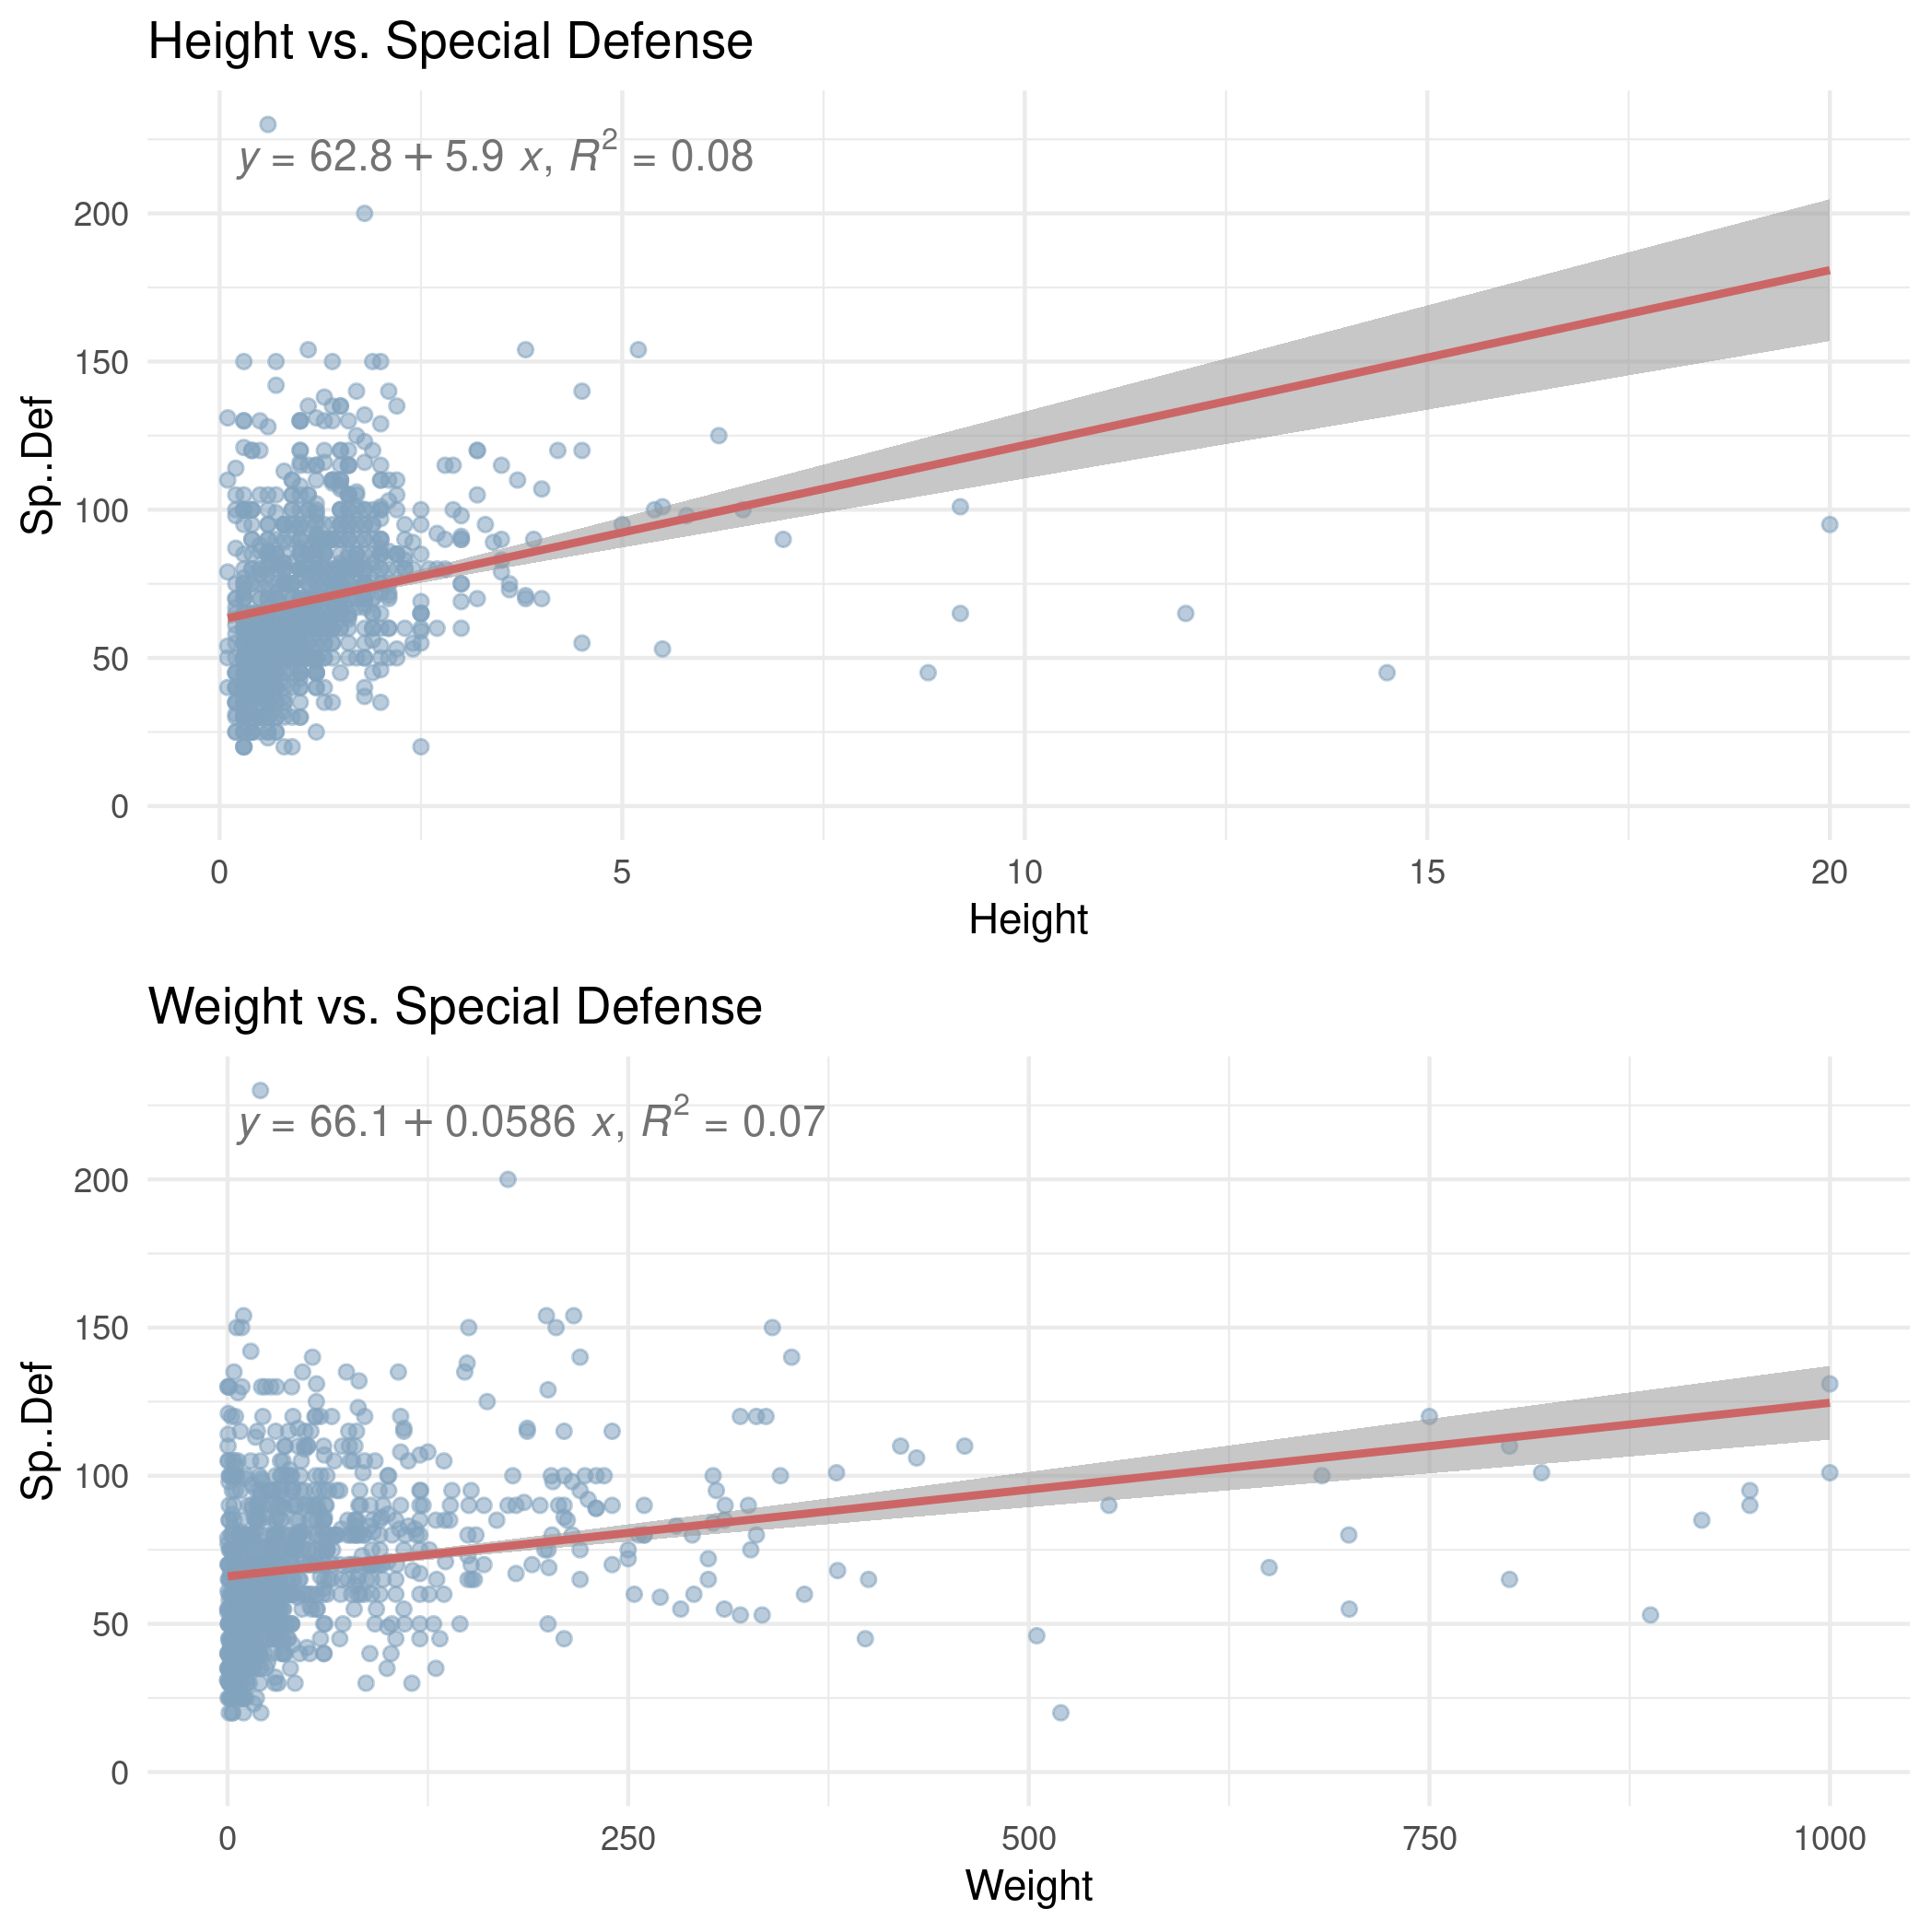
This trend continues where height and special defense are correlated, but no relationship really exists between weight and special defense.
¶Speed
Finally, let’s look at height, weight, and speed.
p1 <- pokedex %>%
        ggplot(aes(x=Height, y=Speed, ymin=0, alpha=0.5)) +
          geom_point(color="#81a2be",show.legend = FALSE) +
          stat_poly_line(show.legend=FALSE,color="#cc6666") +
          stat_poly_eq(use_label(c("eq", "R2"))) +
          theme_minimal() +
          ggtitle("Height vs. Speed") +
          xlab("Height") +
          ylab("Speed")

p2 <- pokedex %>%
        ggplot(aes(x=Weight, y=Speed, ymin=0, alpha=0.5)) +
          geom_point(color="#81a2be",show.legend = FALSE) +
          stat_poly_line(show.legend=FALSE,color="#cc6666") +
          stat_poly_eq(use_label(c("eq", "R2"))) +
          theme_minimal() +
          ggtitle("Weight vs. Speed") +
          xlab("Weight") +
          ylab("Speed")

# Place both plots on a grid
g <- arrangeGrob(p1, p2, nrow=2)

# Save image
ggsave("images/height_weight_speed.png",g)
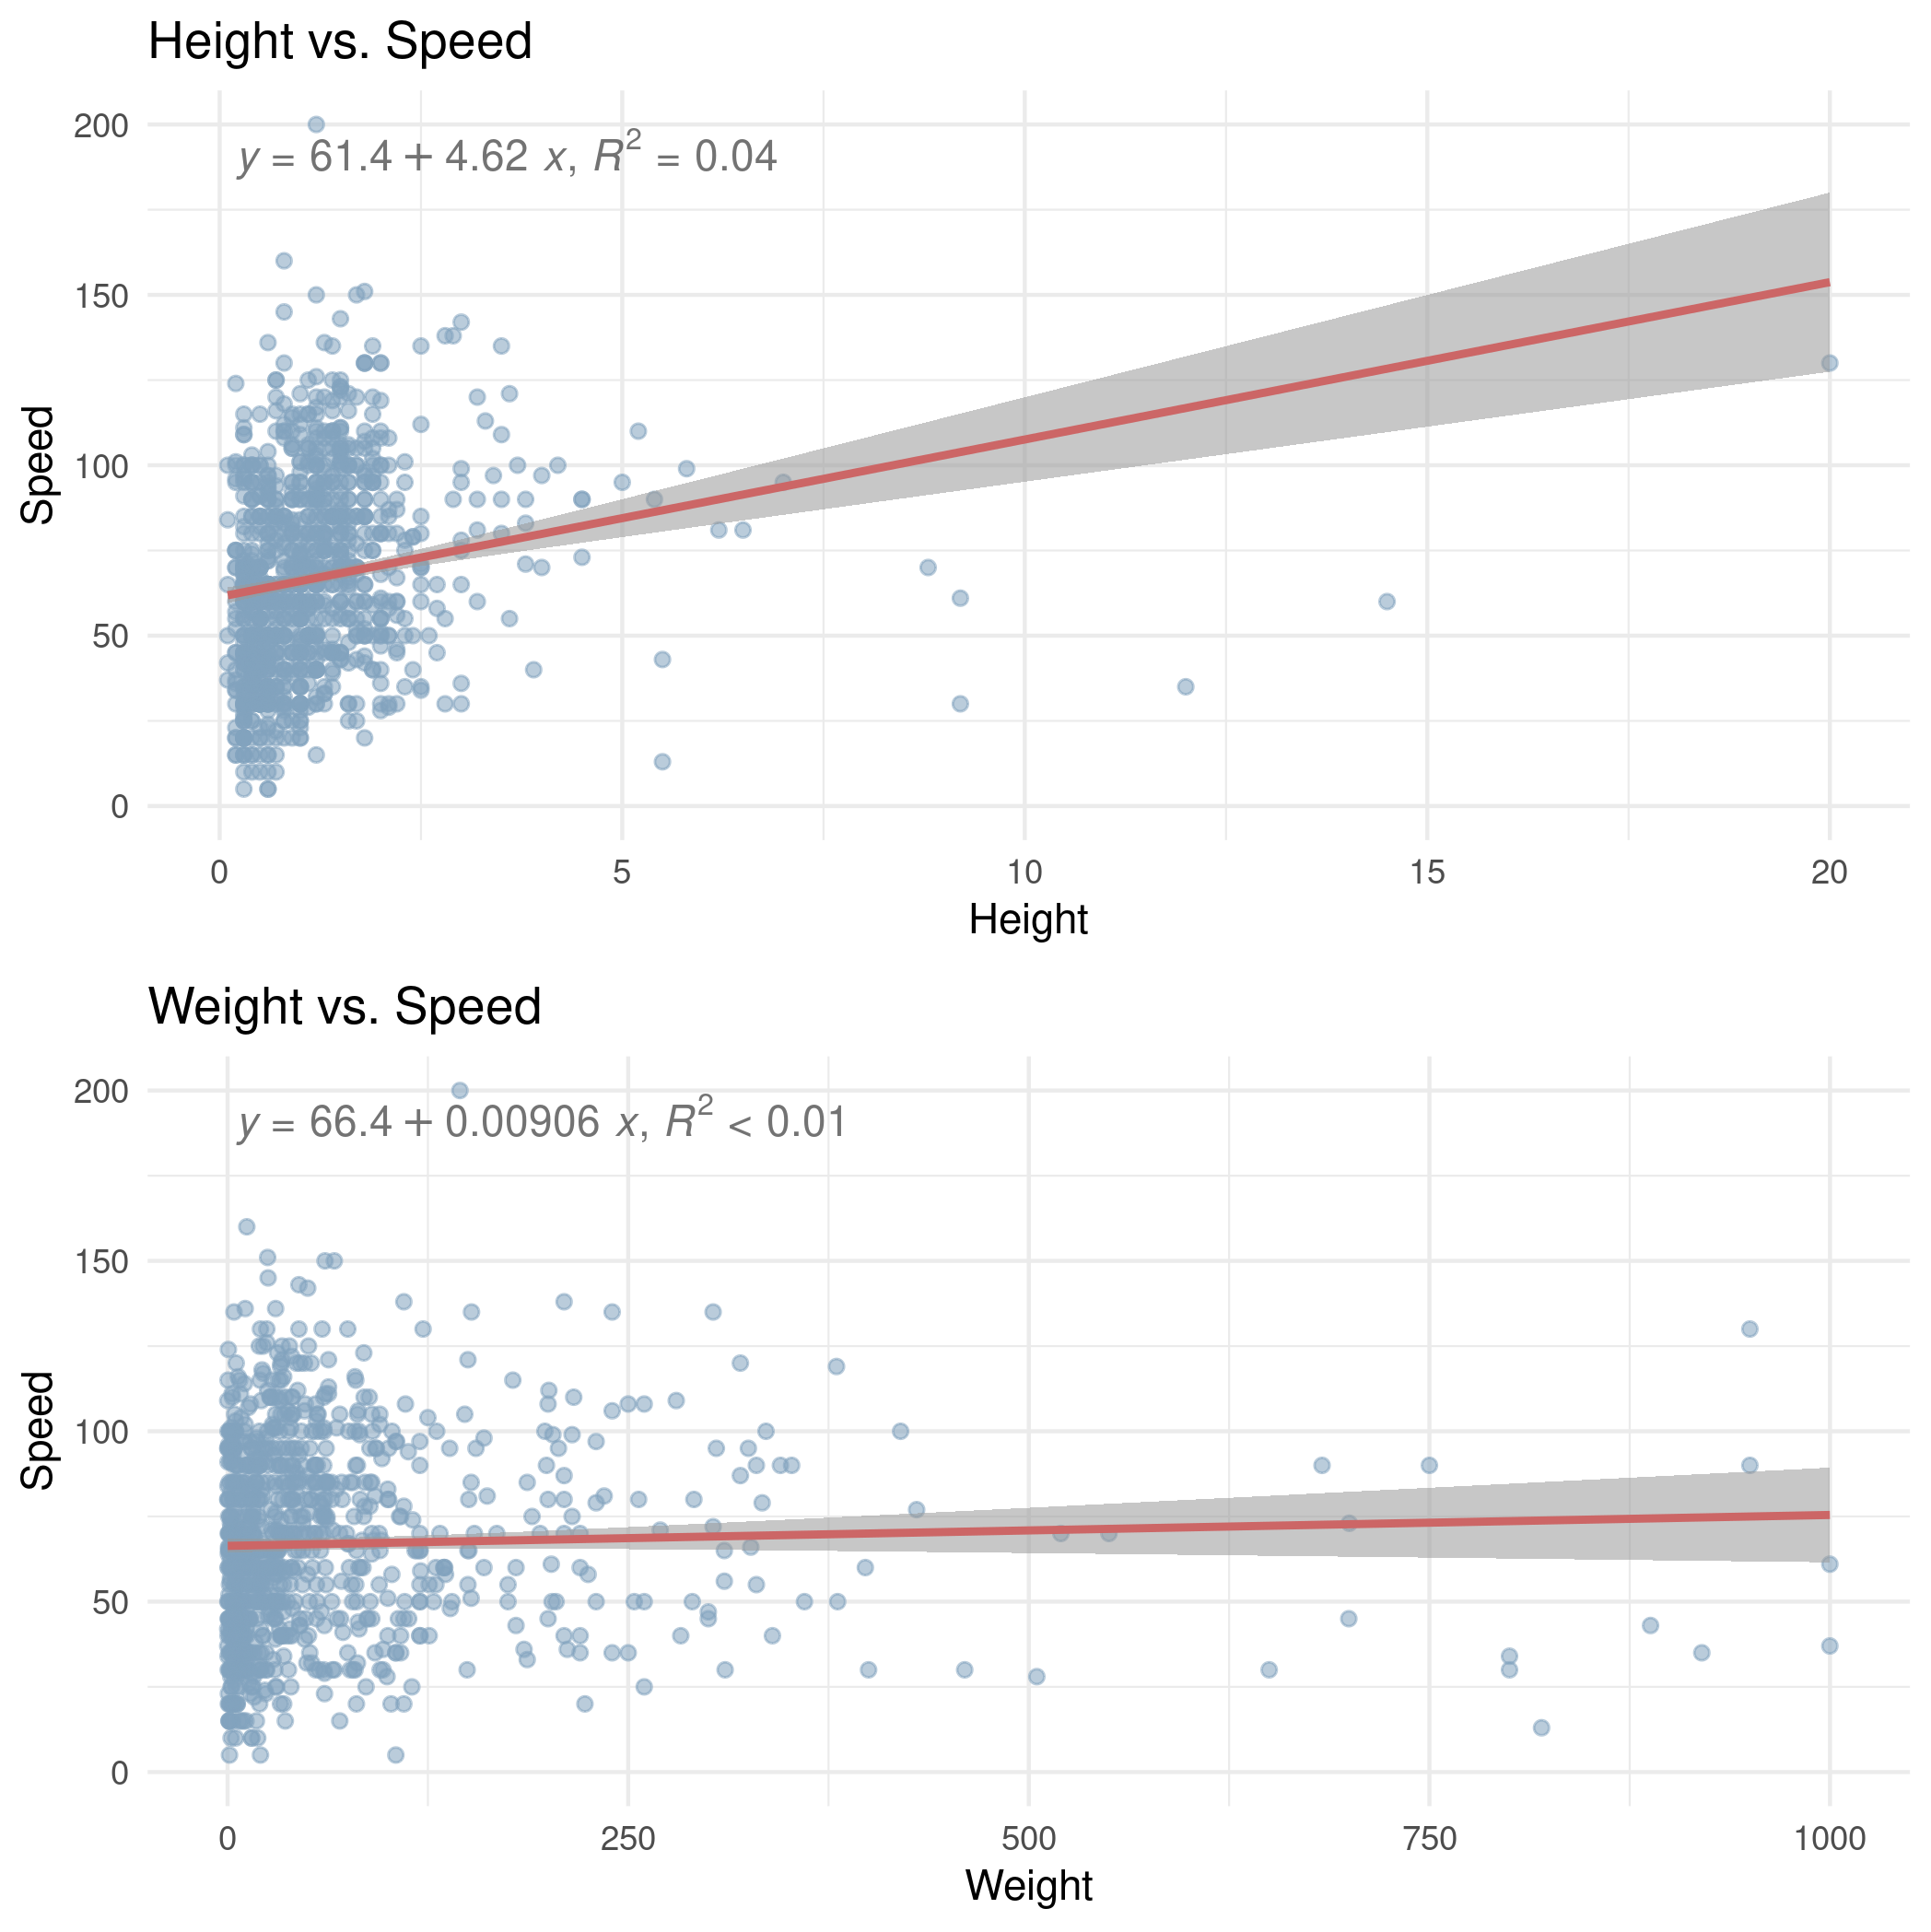
This one is probably the most surprising to me. I don’t have much intution about many of the other stats, but I would certainly have expected that heavier Pokemon are slower. Height and speed are correlated, but surprisingly, there’s almost no relationship between speed and weight! The regression line has practically no slope. I wonder if this is because, as Pokemon evolve, they typically weigh more, but they also see an increase in each stat, so while generally, heavier Pokemon are slower, this is being counteracted by evolution.
Let’s check that out. I’ll look at Pokemon in their first, second, third chain of evolution, in addition to Pokemon that don’t evolve separately. If this hunch is correct, we should see a correlation within each category.
p1 <- pokedex %>%
        filter(Evolution.Place==1) %>%
        ggplot(aes(x=Weight, y=Speed, ymin=0, alpha=0.5)) +
          geom_point(color="#81a2be",show.legend = FALSE) +
          stat_poly_line(show.legend=FALSE,color="#cc6666") +
          stat_poly_eq(use_label(c("eq", "R2"))) +
          theme_minimal() +
          labs(
            title = "Weight vs. Speed",
            subtitle = "First Evolution Pokemon",
            x = "Weight",
            y = "Speed"
          )

p2 <- pokedex %>%
        filter(Evolution.Place==2) %>%
        ggplot(aes(x=Weight, y=Speed, ymin=0, alpha=0.5)) +
          geom_point(color="#81a2be",show.legend = FALSE) +
          stat_poly_line(show.legend=FALSE,color="#cc6666") +
          stat_poly_eq(use_label(c("eq", "R2"))) +
          theme_minimal() +
           labs(
            title = "Weight vs. Speed",
            subtitle = "Second Evolution Pokemon",
            x = "Weight",
            y = "Speed"
          )

p3 <- pokedex %>%
        filter(Evolution.Place==3) %>%
        ggplot(aes(x=Weight, y=Speed, ymin=0, alpha=0.5)) +
          geom_point(color="#81a2be",show.legend = FALSE) +
          stat_poly_line(show.legend=FALSE,color="#cc6666") +
          stat_poly_eq(use_label(c("eq", "R2"))) +
          theme_minimal() +
           labs(
            title = "Weight vs. Speed",
            subtitle = "Third Evolution Pokemon",
            x = "Weight",
            y = "Speed"
          )

p4 <- pokedex %>%
        filter(is.na(Evolution.Place)) %>%
        ggplot(aes(x=Weight, y=Speed, ymin=0, alpha=0.5)) +
          geom_point(color="#81a2be",show.legend = FALSE) +
          stat_poly_line(show.legend=FALSE,color="#cc6666") +
          stat_poly_eq(use_label(c("eq", "R2"))) +
          theme_minimal() +
           labs(
            title = "Weight vs. Speed",
            subtitle = "Pokemon That Don't Evolve",
            x = "Weight",
            y = "Speed"
          )

# Place both plots on a grid
g <- arrangeGrob(p1, p2, p3, p4, nrow=2)

# Save image
ggsave("images/weight_speed_evolution.png",g)
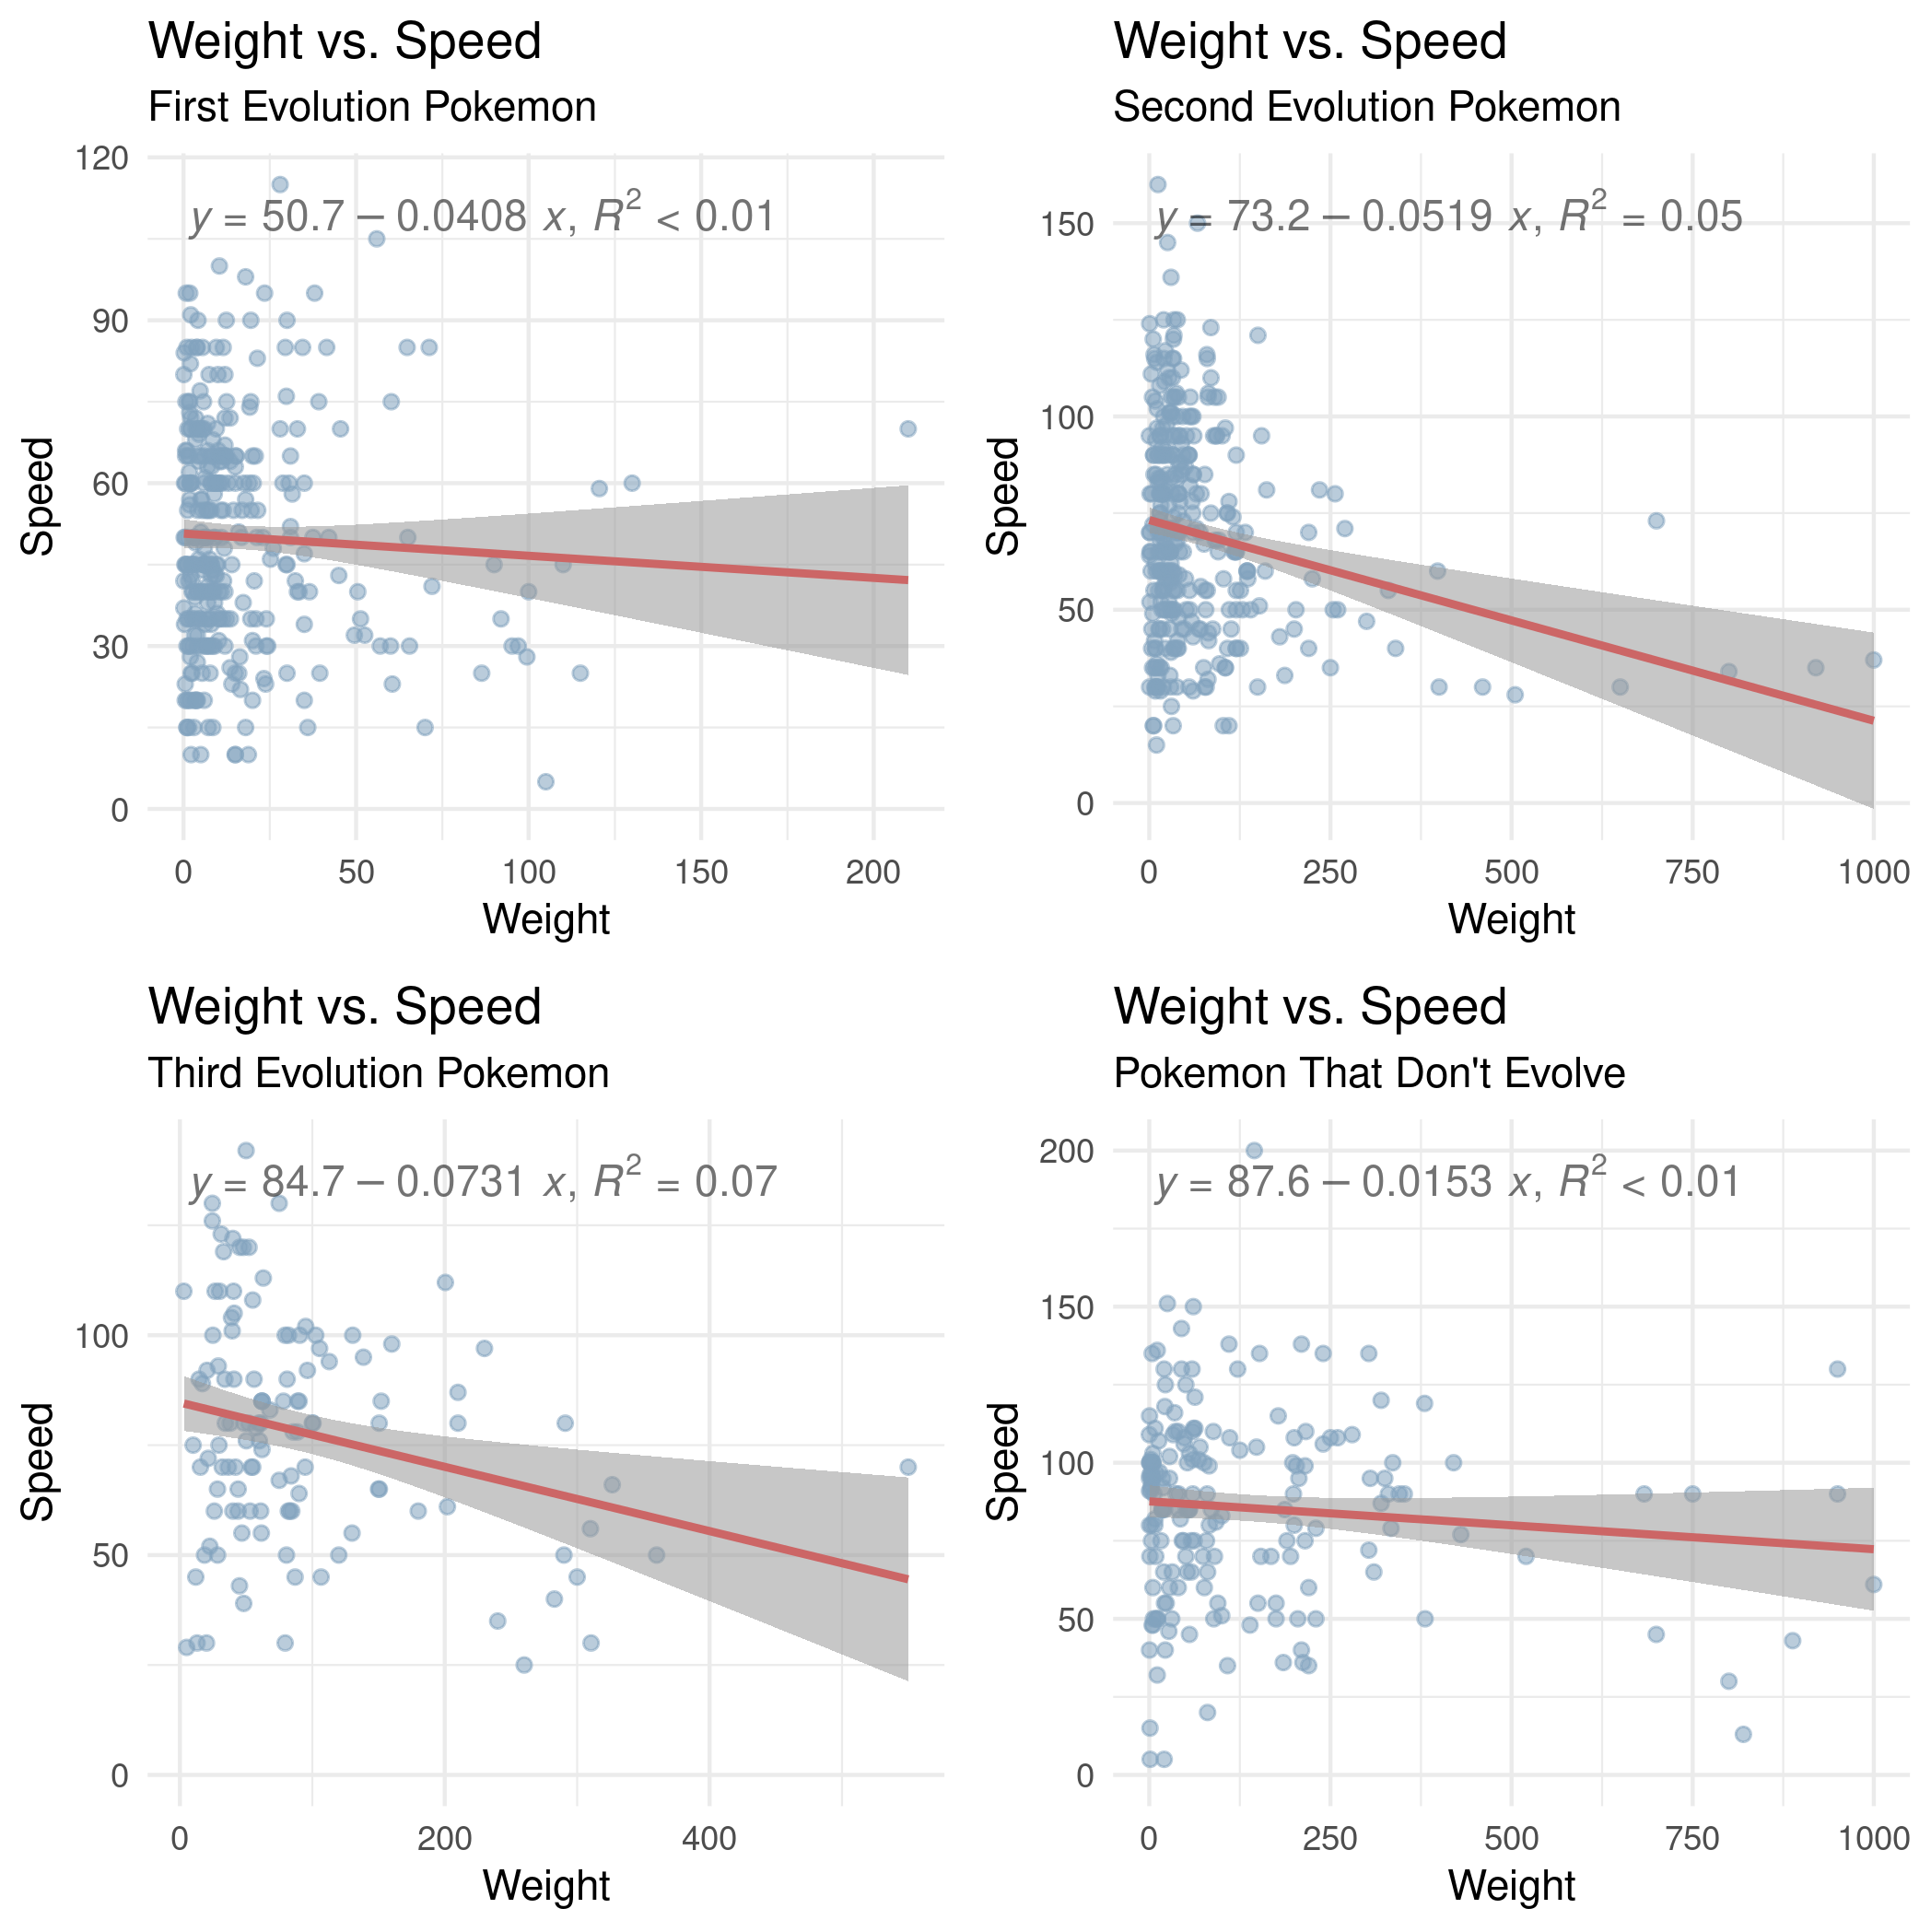
The relationship I was expecting is somewhat more noticeable, particularly in Pokemon in their second and third evolutions, but it’s still a somewhat weak relationship.